【モニタリングに関する問題】
1.
You are a database developer for a company. The company has a server that has multiple physical disks. The disks are not part of a RAID array. The server hosts three Microsoft SQL Server instances. There are many SQL jobs that run during off-peak hours.
You must monitor and optimize the SQL Server to maximize throughput, response time, and overall SQL performance.
You need to identify previous situations where a modification has prevented queries from selecting data in tables.
What should you do?
A. Create a sys.dm_os_waiting_tasks query.
B. Create a sys.dm_exec_sessions query.
C. Create a Performance Monitor Data Collector Set.
D. Create a sys.dm_os_memory_objects query.
E. Create a sp_configure "˜max server memory' query.
F. Create a SQL Profiler trace.
G. Create a sys.dm_os_wait_stats query.
H. Create an Extended Event.
Correct Answer: G
sys.dm_os_wait_stats returns information about all the waits encountered by threads that executed. You can use this aggregated view to diagnose performance issues with SQL Server and also with specific queries and batches.
2.
You are a database developer for a company. The company has a server that has multiple physical disks. The disks are not part of a RAID array. The server hosts three Microsoft SQL Server instances. There are many SQL jobs that run during off-peak hours.
You observe that many deadlocks appear to be happening during specific times of the day.
You need to monitor the SQL environment and capture the information about the processes that are causing the deadlocks. Captured information must be viewable as the queries are running.
What should you do?
A. A. Create a sys.dm_os_waiting_tasks query.
B. Create a sys.dm_exec_sessions query.
C. Create a PerformanceMonitor Data Collector Set.
D. Create a sys.dm_os_memory_objects query.
E. Create a sp_configure "˜max server memory' query.
F. Create a SQL Profiler trace.
G. Create a sys.dm_os_wait_stats query.
H. Create an Extended Event.
Correct Answer: F
To view deadlock information, the Database Engine provides monitoring tools in the form of two trace flags, and the deadlock graph event in SQL Server Profiler.
Trace Flag 1204 and Trace Flag 1222
When deadlocks occur, trace flag 1204 and trace flag 1222 return information that is captured in the SQL Server error log. Trace flag 1204 reports deadlock information formatted by each nodeinvolved in the deadlock. Trace flag 1222 formats deadlock information, first by processes and then by resources. It is possible to enable bothtrace flags to obtain two representations of the same deadlock event.
References:
https://technet.microsoft.com/en-us/library/ms178104(v=sql.105).aspx
3.
You are a database developer for a company. The company has a server that has multiple physical disks. The disks are not part of a RAID array. The server hosts three Microsoft SQL Server instances. There are many SQL jobs that run during off-peak hours.
You must monitor the SQL Server instances in real time and optimize the server to maximize throughput, response time, and overall SQL performance.
What should you do?
A. Create asys.dm_os_waiting_tasks query.
B. Create a sys.dm_exec_sessions query.
C. Create a Performance Monitor Data Collector Set.
D. Create a sys.dm_os_memory_objects query.
E. Create a sp_configure "˜max server memory' query.
F. Create a SQL Profiler trace.
G. Create a sys.dm_os_wait_stats query.
H. Create an Extended Event.
Correct Answer: B
sys.dm_exec_sessions returns one row per authenticated session on SQL Server. sys.dm_exec_sessions is a server-scope view that shows information about all active user connections and internal tasks. This information includes client version, client program name, client login time, login user, current session setting, and more. Use sys.dm_exec_sessions to first view the current system load and to identify a session of interest, and then learn more information about that session by using other dynamic management views or dynamic management functions.
Examples of use include finding long-running cursors, and finding idle sessions that have open transactions.
4.
You are a database developer for a company. The company has a server that has multiple physical disks. The disks are not part of a RAID array. The server hosts three Microsoft SQL Server instances. There are many SQL jobs that run during off-peak hours.
You must monitor the SQL Server instances in real time and optimize the server to maximize throughput, response time, and overall SQL performance.
You need to ensure that the performance of each instance is consistent for the same queried and query plans.
What should you do?
A. Create a sys.dm_os_waiting_tasks query.
B. Create a sys.dm_exec_sessions query.
C. Create a Performance Monitor Data Collector Set.
D. Create a sys.dm_os_memory_objects query.
E. Create a sp_configure "˜max server memory' query.
F. Create a SQL Profiler trace.
G. Create asys.dm_os_wait_stats query.
H. Create an Extended Event.
Correct Answer: H
Advanced Viewing of Target Data from Extended Events in SQL Server
When your event session is currently active, you might want to watch the event data in real time, as it is received by the target.
Management > Extended Events > Sessions > [your-session] > Watch Live Data.
The query_post_execution_showplan extended event enables you to see the actual query plan in the SQL Server Management Studio (SSMS) UI. When the
Details pane is visible, you can see a graph of the query plan on the Query Plan tab. By hovering over a node on the query plan, you cansee a list of property names and their values for the node.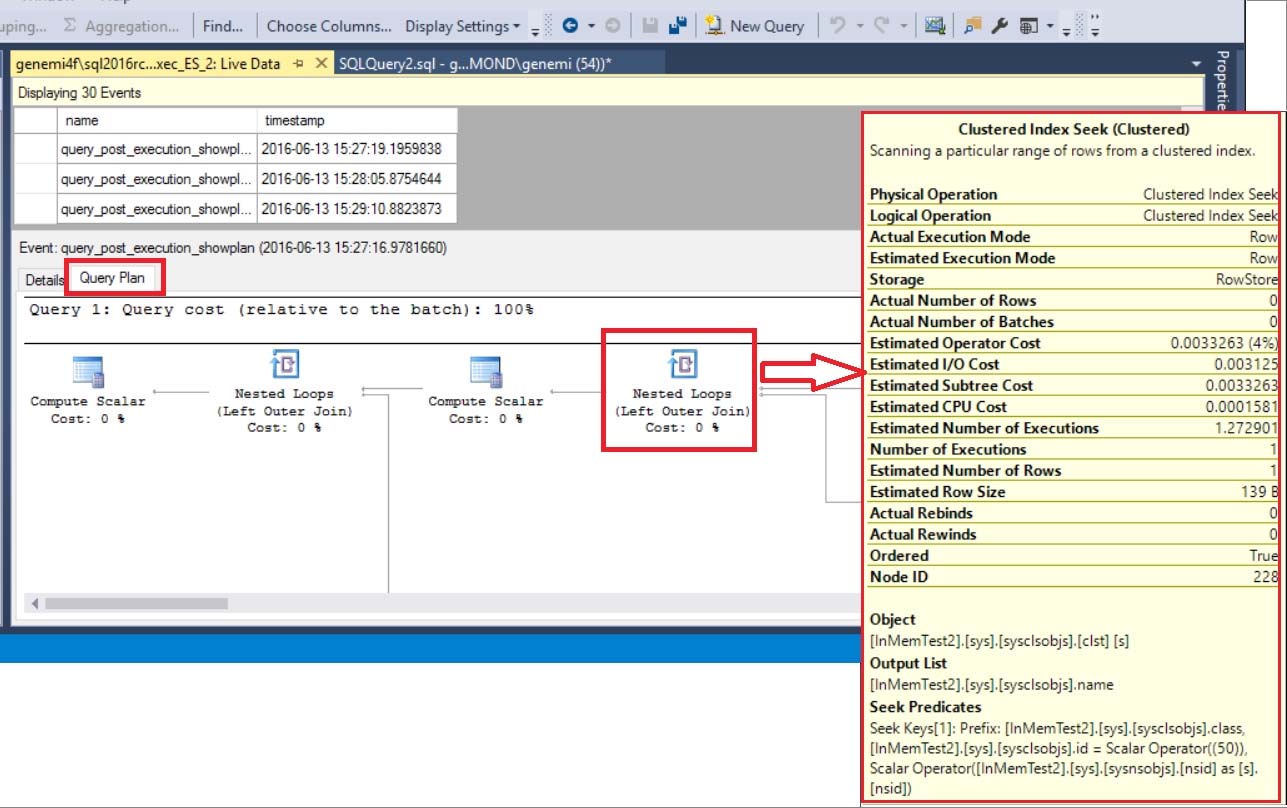
References:
https://msdn.microsoft.com/en-us/library/mt752502.aspx
5.
You are a database developer for a company. The company has a server that has multiple physical disks. The disks are not part of a RAID array. The server hosts three SQL Server instances. There are many SQL jobs that run during off-peak hours.
You must monitor the SQL Server instances in real time and optimize the server to maximize throughput, response time, and overall SQL performance.
You need to collect query performance data while minimizing the performance impact on the SQL Server.
What should you do?
A. Create a sys.dm_os_waiting_tasks query.
B. Create a sys.dm_exec_sessions query.
C. Create a Performance Monitor Data Collector Set.
D. Create a sys.dm_os_memory_objects query.
E. Create a sp_configure "˜max server memory' query.
F. Create a SQL Profiler trace.
G. Create a sys.dm_os_wait_stats query.
H. Create an Extended Event.
Correct Answer: C
SQL Server Data Collector is a feature for performance monitoring and tuning available in SQL Server Management Studio.
Integration Services packages transform and load the collected data into the Microsoft Data Warehouse database.
Collection sets are defined and deployed on a server instance and can be run independently of each other. Each collection set can be applied to a target that matches the target types of all the collector types that are part of a collection set. The collection set is run by a SQL Server Agent job or jobs, and data is uploaded to the management data warehouse on a predefined schedule.
Predefined data collection sets include:
✑ The Query Statistics data collection set collects information about query statistics, activity, execution plans and text on the SQL Server instance. It does not store all executed statements, only 10 worst performing ones.
✑ Disk Usage data collection set collects information about disk space used by both data and log files for all databases on the SQL Server instance, growth trends, and average day growth.
Etc.
References:
http://www.sqlshack.com/sql-server-performance-monitoring-data-collector/
6.
You are a database developer for a company. The company has a server that has multiple physical disks. The disks are not part of a RAID array. The server hosts three SQL Server instances. There are many SQL jobs that run during off-peak hours.
You must monitor the SQL Server instances in real time and optimize the server to maximize throughput, response time, and overall SQL performance.
You need to create a baseline set of metrics to report how the computer running SQL Server operates under normal load. The baseline must include the resource usage associated with the server processes.
What should you do?
A. Create a sys.dm_os_waiting_tasks query.
B. Create a sys.dm_exec_sessions query.
C. Create a Performance Monitor Data Collector Set.
D. Create a sys.dm_os_memory_objects query.
E. Create a sp_configure "˜max server memory' query.
F. Create a SQL Profiler trace.
G. Create asys.dm_os_wait_stats query.
H. Create an Extended Event.
Correct Answer: D
sys.dm_os_memory_objects returns memory objects that are currently allocated by SQL Server. You can usesys.dm_os_memory_objects to analyze memory use and to identify possible memory leaks.
Example: The following example returns the amount of memory allocated by each memory object type.
SELECT SUM (pages_in_bytes) as 'Bytes Used', type
FROMsys.dm_os_memory_objects
GROUP BY type
ORDER BY 'Bytes Used' DESC;
GO
7.
You are experiencing performance issues with the database server.
You need to evaluate schema locking issues, plan cache memory pressure points, and backup I/O problems.
What should you create?
A. a System Monitor report
B. a sys.dm_tran_database_transaction dynamic management view query
C. an Extended Events session that uses Query Editor
D. an Activity Monitor session in Microsoft SQL Management Studio.
Correct Answer: D
References:
https://msdn.microsoft.com/en-us/library/hh212951.aspx
8.
You use Microsoft SQL Server Profile to evaluate a query named Query1. The Profiler report indicates the following issues:
✑ At each level of the query plan, a low total number of rows are processed.
✑ The query uses many operations. This results in a high overall cost for the query.
You need to identify the information that will be useful for the optimizer.
What should you do?
A. Start a SQL Server Profiler trace for the event class Performance statistics in the Performance event category.
B. Create one Extended Events session with the sqlserver.missing_column_statistics event added.
C. Start a SQL Server Profiler trace for the event class Soft Warnings in the Errors and Warnings event category.
D. Create one Extended Events session with the sqlserver.error_reported event added.
Correct Answer: A
The Performance Statistics event class can be used to monitor the performance of queries, stored procedures, and triggers that are executing. Each of the six event subclasses indicates an event in the lifetime of queries, stored procedures, and triggers within the system. Using the combination of these event subclasses and the associated sys.dm_exec_query_stats, sys.dm_exec_procedure_stats and sys.dm_exec_trigger_stats dynamic management views, you can reconstitute the performance history of any given query, stored procedure, or trigger.
References:
https://docs.microsoft.com/en-us/sql/relational-databases/event-classes/performance-statistics-event-class?view=sql-server-2017
9.
You have an existing Microsoft SQL Trace script. You plan to convert the script to an Extended Events session.
You need to collect the trace ID and other required information.
Which system table should you use?
A. dbo.sysnotifications
B. dbo.syssessions
C. trace_xe_action_map
D. sysdbmainplans
Correct Answer: C
References:
https://docs.microsoft.com/en-us/sql/relational-databases/extended-events/convert-an-existing-sql-trace-script-to-an-extended-events-session?view=sql-server-
2017
10.
You are a database developer for a company. The company has a server that has multiple physical disks. The disks are not part of a RAID array. The server hosts three Microsoft SQL Server instances. There are many SQL jobs that run during off-peak hours.
You must monitor and optimize the SQL Server to maximize throughput, response time, and overall SQL performance.
You need to examine delays in executed threads, including errors with queries and batches.
What should you do?
A. Create a sys.dm_os_waiting_tasks query.
B. Create a sys.dm_exec_sessions query.
C. Create a Performance Monitor Data Collector Set.
D. Create a sys.dm_os_memory_objects query.
E. Create a sp_configure "˜max server memory'query.
F. Create a SQL Profiler trace.
G. Create a sys.dm_os_wait_stats query.
H. Create an Extended Event.
Correct Answer: G
sys.dm_os_wait_stats returns information about all the waits encountered by threads that executed. You can use this aggregated view to diagnose performance issues with SQL Server and also with specific queries and batches.
Incorrect Answers:
A: sys.dm_os_waiting_tasks returns information about the wait queue of tasks that are waiting on some resource.
References:
https://docs.microsoft.com/en-us/sql/relational-databases/system-dynamic-management-views/sys-dm-os-wait-stats-transact-sql
11.
You are experiencing performance issues with the database server.
You need to evaluate schema locking issues, plan cache memory pressure points, and backup I/O problems.
What should you create?
A. a System Monitor report
B. a sys.dm_tran_database_transaction dynamic management view query
C. an Extended Events session that uses Query Editor
D. a Microsoft SQL Profiler trace
Correct Answer: C
Extended Events: considered as "the best way" by the SQL Server purists. You can configure Extended Events to find Locking Issues in SQL Server.
Incorrect Answers:
D: SQL Trace and SQL Server Profiler are deprecated. The Microsoft.SqlServer.Management.Trace namespace that contains the Microsoft SQL Server Trace and Replay objects are also deprecated.
This feature is in maintenance mode and may be removed in a future version of Microsoft SQL Server. Avoid using this feature in new development work, and plan to modify applications that currently use this feature.
Use Extended Events instead.
References:
https://www.mssqltips.com/sqlservertip/5752/configuring-extended-events-to-find-locking-issues-in-sql-server/
12.
You have multiple queries that take a long time to complete.
You need to identify the cause by using detailed information about the Transact-SQL statements in the queries. The Transact-SQL statements must not run as part of the analysis.
Which Transact-SQL statement should you run?
A. SET STATISTICS IO ON
B. SET SHOWPLAN_TEXT ON
C. SET STATISTICS XML ON
D. SET STATISTICS PROFILE ON
Correct Answer: B
SET SHOWPLAN_TEXT ON causes Microsoft SQL Server not to execute Transact-SQL statements. Instead, SQL Server returns detailed information about how the statements are executed.
Incorrect Answers:
C: SET STATISTICS XML ON causes Microsoft SQL Server to execute Transact-SQL statements and generate detailed information about how the statements were executed in the form of a well-defined XML document.
D: When STATISTICS PROFILE is ON, each executed query returns its regular result set, followed by an additional result set that shows a profile of the query execution.
The additional result set contains the SHOWPLAN_ALL columns for the query and these additional columns.
Column name, Description -
Rows: Actual number of rows produced by each operator
Executes: Number of times the operator has been executed
References:
https://docs.microsoft.com/en-us/sql/t-sql/statements/set-showplan-text-transact-sql



※コメント投稿者のブログIDはブログ作成者のみに通知されます