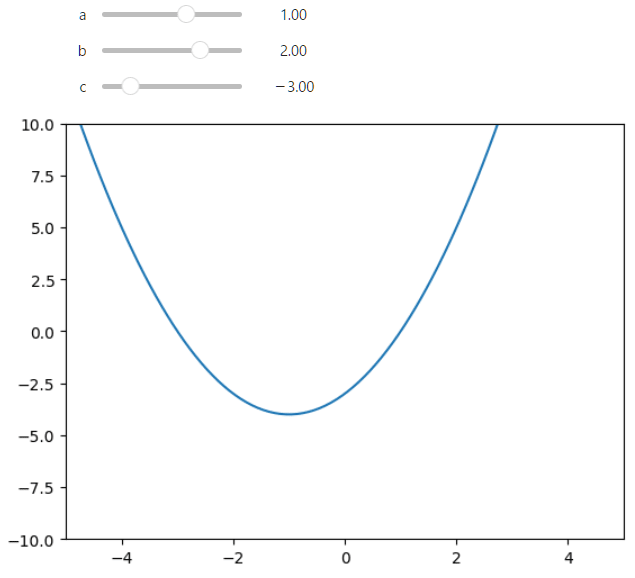
jupyter notebook で二次関数 f(x) = ax^2 + bx + c のパラメータ a, b, c をインタラクティブに変更してグラフを描画できるようにしてみました。

%matplotlib inline
import matplotlib.pyplot as plt
from ipywidgets import interact
import numpy as np

def f(a, b, c, x):
    return a * x**2 + b * x + c

def plot_f(a, b, c):
    x = np.linspace(-5, 5, num=100)
    y = f(a, b, c, x)

    fig, ax = plt.subplots()
    ax.plot(x, y)
    ax.set_xlim(-5, 5)
    ax.set_ylim(-10, 10)
    plt.show()

interact(plot_f,
	a=(-5.0, 5.0, 0.1),
	b=(-5.0, 5.0, 0.1),
	c=(-5.0, 5.0, 0.1))


