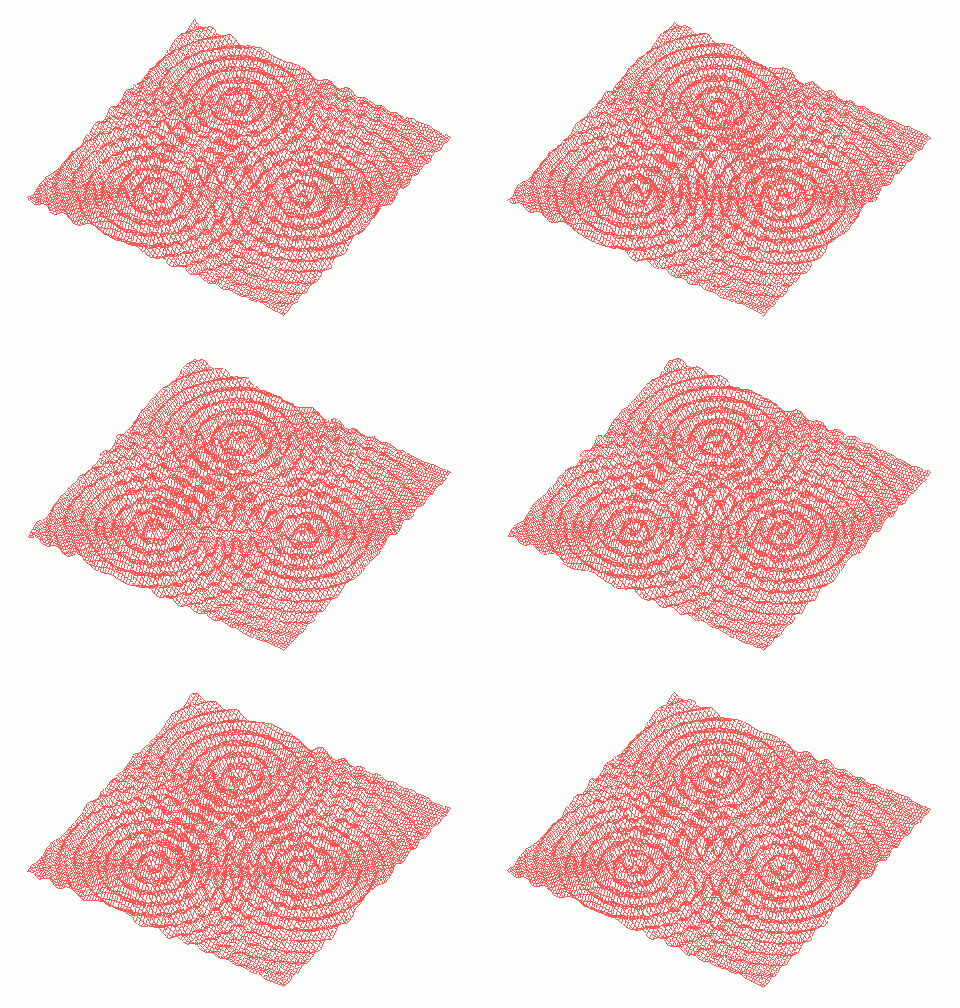
gnuplotを使ってこのような物理アニメーションを作る手順の解説をしよう。
1)gnuplotを起動しつぎのコマンドを順番に入力。グラフが表示されるので、マウスを使ってグラフが見やすい角度に調整しておく。(表示させたい関数はf(x,y,t)=ではじまる行に定義する。)
gnuplot> set xrange [-30:30]
gnuplot> set yrange [-30:30]
gnuplot> set isosamples 100,100
gnuplot> unset key
gnuplot> unset border
gnuplot> unset xtics
gnuplot> unset ytics
gnuplot> unset ztics
gnuplot> f(x,y,t)=exp(-((x-15)*(x-15)+(y-10)*(y-10))/500)*cos(2*sqrt((x-15)*(x-15)+(y-10)*(y-10))-2*pi*t/30)/5+exp(-((x+15)*(x+15)+(y-10)*(y-10))/500)*cos(2*sqrt((x+15)*(x+15)+(y-10)*(y-10))-2*pi*t/30)/5+exp(-((x-0)*(x-0)+(y+15)*(y+15))/500)*cos(2*sqrt((x-0)*(x-0)+(y+15)*(y+15))-2*pi*t/30)/5
splot f(x,y,0)
2)script.gp というファイル名で次のようなスクリプトを作成する。(テキスト形式)
set terminal pbm color medium
set output "graph00.ppm"; splot f(x,y,0)
set output "graph01.ppm"; splot f(x,y,1)
set output "graph02.ppm"; splot f(x,y,2)
set output "graph03.ppm"; splot f(x,y,3)
set output "graph04.ppm"; splot f(x,y,4)
set output "graph05.ppm"; splot f(x,y,5)
set output "graph06.ppm"; splot f(x,y,6)
set output "graph07.ppm"; splot f(x,y,7)
set output "graph08.ppm"; splot f(x,y,8)
set output "graph09.ppm"; splot f(x,y,9)
set output "graph10.ppm"; splot f(x,y,10)
set output "graph11.ppm"; splot f(x,y,11)
set output "graph12.ppm"; splot f(x,y,12)
set output "graph13.ppm"; splot f(x,y,13)
set output "graph14.ppm"; splot f(x,y,14)
set output "graph15.ppm"; splot f(x,y,15)
set output "graph16.ppm"; splot f(x,y,16)
set output "graph17.ppm"; splot f(x,y,17)
set output "graph18.ppm"; splot f(x,y,18)
set output "graph19.ppm"; splot f(x,y,19)
set output "graph20.ppm"; splot f(x,y,20)
set output "graph21.ppm"; splot f(x,y,21)
set output "graph22.ppm"; splot f(x,y,22)
set output "graph23.ppm"; splot f(x,y,23)
set output "graph24.ppm"; splot f(x,y,24)
set output "graph25.ppm"; splot f(x,y,25)
set output "graph26.ppm"; splot f(x,y,26)
set output "graph27.ppm"; splot f(x,y,27)
set output "graph28.ppm"; splot f(x,y,28)
set output "graph29.ppm"; splot f(x,y,29)
set terminal windows
unset output
3)gnuplotのコマンドラインから次のコマンドを入力してスクリプトを実行する。するとアニメーションの元となる画像ファイルが30個出力される。
gnuplot> load "script.gp"
4)IrfanViewのようなグラフィックツールの一括ファイル変換機能でgraph**.ppmをそれぞれgraph**.gifに変換する。その際に画像の位置切り出し、縦横のサイズ変更、色の変更など施したいオプションを選択する。
5)変換された30個のGIFファイルをGiamというツールを使ってGIFアニメーションのファイルに変換する。
ブログ執筆のはげみになりますので、1つずつ応援クリックをお願いします。


