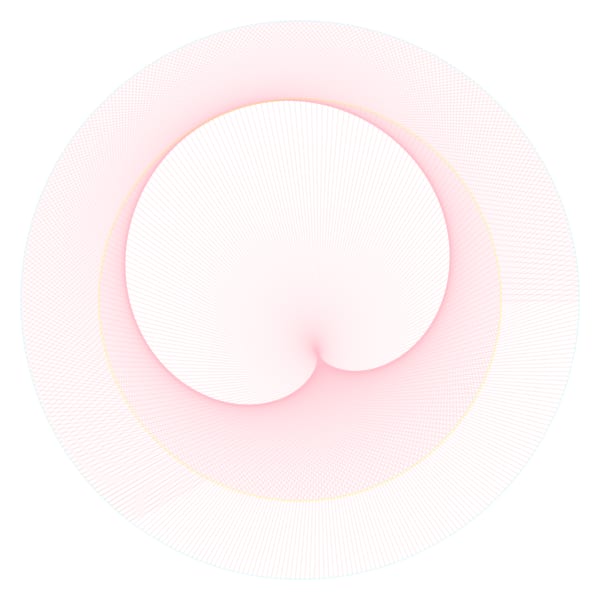
Spirograph pattern: Venus x Earth
https://jp.mathworks.com/matlabcentral/communitycontests/contests/4/entries/3621
にある。
西洋占星術のページでは「地球と金星を結ぶ線分が薔薇を描く」と神秘的な取り扱いをしているところもある。
が,まあ,要するにスピログラフ Spirograph である。
Julia で書いて(描いて)みた。
using Plots
function roseofplanet(radius1, period1, radius2, period2; step=4, n=div(lcm(period1, period2), step), w=400, h=400)
function circle(r, color=:green)
θ = range(0, 360, length=1000)
plot!(r .* cosd.(θ), r .* sind.(θ), color=color, lwd=0.4)
end
pyplot(grid=false, aspect_ratio=1, size=(w, h),
xlabel="", ylabel="", label="", alpha=0.2)
θ1 = range(0, step=360/period1*step, length=n)
θ2 = range(0, step=360/period2*step, length=n)
x1 = radius1 .* cosd.(θ1);
y1 = radius1 .* sind.(θ1);
x2 = radius2 .* cosd.(θ2);
y2 = radius2 .* sind.(θ2);
plot(showaxis=false);
for (xi, yi, xj, yj) in zip(x1, y1, x2, y2)
plot!([xi, xj], [yi, yj], color=:pink, lwd=0.2)
end
circle(radius1, :cadetblue1)
circle(radius2, :yellow)
plot!()
savefig("fig.pdf")
end
引数
radius1, period1 片方の惑星の長半径と公転周期
radius2, period2 もう一方の惑星の長半径と公転周期
step=4 何日おきに描くか
n=div(lcm(period1, period2), step) 全描画日数
w=400, h=400 画像のピクセルサイズ
スピログラフの肝は,2個の惑星の公転周期が素であってはあまり良くないということだ。
例に挙げられている地球と金星の場合だと,実際の 365.2 日と 224.7 日を 364, 224 とするときれいな図になる。
rVenus, vVenus = 1.08, 224; # 1.082, 224.7
rEarth, vEarth = 1.50, 364; #1.495, 365.2
rMercury, vMercury = 0.579, 88; # 1.082, 224.7
rMars, vMars = 2.279, 690; # 2.279, 687
roseofplanet(rEarth, vEarth, rVenus, vVenus, step=4)

step=1 にすると,より本物らしく見える?
roseofplanet(rEarth, vEarth, rVenus, vVenus, step=1)
途中まで描画するとカージオイドが見える。
roseofplanet(rEarth, vEarth, rVenus, vVenus, step=1, n=600)
単なるスピログラフなので,金星と水星,火星と地球でも似たようなものができる。薔薇というより菊に近いか。
roseofplanet(rVenus, vVenus, rMercury, vMercury, step=2)
roseofplanet(rMars, vMars, rEarth, vEarth, step=50)
ネフロイドも見える。
roseofplanet(1, 100, 0.8, 300, step=1)


