裏 RjpWiki

Julia ときどき R, Python によるコンピュータプログラム,コンピュータ・サイエンス,統計学

Julia で五数要約値(R の fivenum 関数)

2021年06月30日 | ブログラミング

R の fivenum 関数を Julia に移植する。

function fivenum!(x)
  sort!(x)
  n = length(x)
  n4 = floor(Int, (n + 3) / 2) / 2
  d = [1, n4, (n + 1) / 2, n + 1 - n4, n]
  @. 0.5 * (x[floor(Int, d)] + x[ceil(Int, d)])
end

fivenum! は,最小値,下ヒンジ,中央値,上ヒンジ,最大値の 5 つの要約値を求める。

下ヒンジは,データ全体の中央値以下のデータの中央値,

上ヒンジは,データ全体の中央値以上のデータの中央値である。

データの個数 n = length(x) として,n % 4 つまり n を 4 で割った余りが 0, 1, 2, 3 の 4 パターンで,昇順に並べ替えたデータを配置するとわかりやすい。地色が黄色の数字が五数要約値。赤で示した数値は,中央値直近の二数の平均値である。

これを

  n4 = floor(Int, (n + 3) / 2) / 2
  d = [1, n4, (n + 1) / 2, n + 1 - n4, n]
  @. 0.5 * (x[floor(Int, d)] + x[ceil(Int, d)])

で記述するとは素晴らしい。

なお,quantile!() で求められる 25パーセンタイル値 Q1 と 75 パーセンタイル値 Q3 は

n が奇数の場合は下ヒンジ,上ヒンジと同じになるが,

n が偶数の場合は,同じにはならない。

また,高校の数学では,「データを小さい方から大きい方まで並べてメジアンをとる。そのメジアンを落として,メジアンより小さいデータのまたメジアンをとってそれを第一四分位数とする。メジアンより大きいデータのまたメジアンをとってそれを第三四分位数とする。」というような定義なので,n が奇数の場合にはヒンジとは異なる。

コメント
  • X
  • Facebookでシェアする
  • はてなブックマークに追加する
  • LINEでシェアする

Julia の小ネタ--030 円周率 π の高精度表示

2021年06月28日 | ブログラミング

Julia では π は特殊な型を持つ

typeof(π)Irrational{:π}

なので,

π # π = 3.1415926535897...

という表示になる。 ... に意味がある。

big(π) あるいは BigFloat(π)

3.141592653589793238462643383279502884197169399375105820974944592307816406286198

になるが,もっと桁数が欲しい(?)ときは,

setprecision(BigFloat, 4096) do
    BigFloat(pi)
end

などとすると,

3.1415926535897932384626433832795028841971693993751058209749445923078164062862089986280348253421170679821480865132823066470938446095505822317253594081284811174502841027019385211055596446229489549303819644288109756659334461284756482337867831652712019091456485669234603486104543266482133936072602491412737245870066063155881748815209209628292540917153643678925903600113305305488204665213841469519415116094330572703657595919530921861173819326117931051185480744623799627495673518857527248912279381830119491298336733624406566430860213949463952247371907021798609437027705392171762931767523846748184676694051320005681271452635608277857713427577896091736371787214684409012249534301465495853710507922796892589235420199561121290219608640344181598136297747713099605187072113499999983729780499510597317328160963185950244594553469083026425223082533446850352619311881710100031378387528865875332083814206171776691473035982534904287554687311595628638823537875937519577818577805321712268066130019278766111959092164201989380952572010654858632788659361533818279682303019520353018529689957736225994138912497217752834791315155748572424541506959508295331168617278558890750983817546374649393192550604009277016711390098488240128583616035637076601047101819429564

が得られる。4096 が計算に使うビット数ということで,これを大きくすればいくらでも桁数を増やせる。

指定するビット数を n とすれば,ほぼ n*log10(2) 桁が表示される。

コメント
  • X
  • Facebookでシェアする
  • はてなブックマークに追加する
  • LINEでシェアする

Julia の小ネタ--029 実数演算の誤差

2021年06月27日 | ブログラミング

どうという計算ではないのに,結果が違う。

実数演算にはご注意ということではあるが。

x = 0.0:0.1:1.0

n が 123 のときは,両辺等しい。

n = 123
n*x .== n*collect(x)

11-element BitVector:
 1
 1
 1
 1
 1
 1
 1
 1
 1
 1
 1

n が 122 のときは,等しくない

n = 122
n*x .== n*collect(x)

11-element BitVector:
 1
 0
 0
 1
 0
 1
 1
 0
 0
 1
 1

コメント
  • X
  • Facebookでシェアする
  • はてなブックマークに追加する
  • LINEでシェアする

ダイナマイトプロット 再び

2021年06月26日 | ブログラミング

また,最近,「妖怪ダイナマイトプロット」 dynamite plot, plunger plot, dynamite plumger が出現か

これを勧める,描画するプログラムを掲出するということがあるので,再度,警告を発す。


https://blog.goo.ne.jp/r-de-r/e/4c6b881f0dc2bbc8068d6d993231e566
https://blog.goo.ne.jp/r-de-r/e/1550276d3d78445e4d0d4c8cd66c7101

ダイナマイトプロットは,絶滅すべし!!!

ダイナマイトプロットを掲載している学術誌は,購読する必要なし。改心せよ。


コメント
  • X
  • Facebookでシェアする
  • はてなブックマークに追加する
  • LINEでシェアする

いわゆる関数電卓サイトで 4π/2π を計算してみた

2021年06月25日 | ブログラミング

いわゆる電卓サイトで 4π÷2π を計算するとどうなるか。実際にやってみた。

Julia だと 4π / 2π ==> 2 なのだが,

4π / 2π == 4 * π / 2 * π ==> 19.739208802178716

とするものや,そもそも 4π という入力を許さないものなど,さまざまだ。

まあ,多くのプログラム言語では 4 * π / 2 * π == 2 * π^2 という解釈になるだろう。

==================================

https://www.google.com/search?client=firefox-b-d&q=%E9%96%A2%E6%95%B0%E9%9B%BB%E5%8D%93
演算子の省略は異なった解釈

==================================

https://www.desmos.com/scientific?lang=ja
うれしい

==================================

https://tomari.org/main/java/dentaku_kansuu.html
演算子の省略は許してくれない

==================================

google の検索フィールドに入力
うれしい結果

==================================

https://keisan.casio.jp/calculator
うれしい結果

==================================

https://cattech-lab.com/science-tools/function-calculator/
演算子の省略は許してくれない

==================================

https://rakko.tools/tools/128/
演算子の省略は許してくれない

==================================

https://www.wolframalpha.com/input/?i=4pi%2F2pi&lang=ja
演算子の省略は違った結果になる

コメント
  • X
  • Facebookでシェアする
  • はてなブックマークに追加する
  • LINEでシェアする

Julia の小ネタ--028 NaN と missing

2021年06月22日 | ブログラミング

missing は他の言語の NaN ではない。NaN も他の言語の NaN ではない?

b = NaN
isnan(b) || ismissing(b) # true
isnan(b) |  ismissing(b) # true

c = missing
isnan(c) || ismissing(c) # TypeError: non-boolean (Missing) used in boolean context
isnan(c) |  ismissing(c) # true

なぜそうなのか

isnan(NaN)         # true
isnan(missing)     # missing
ismissing(NaN)     # false
ismissing(missing) # true

isnan(missing) || ismissing(missing) # TypeError: non-boolean (Missing) used in boolean context
isnan(missing) |  ismissing(missing) # true

isnan(missing) は論理値 true/false ではないので論理演算 or すなわち || はできないということ。

ビット演算 | ならできる...謎

isnan(missing)missing であっても,

isnan(missing) == missing # は missing であって,true ではない


コメント
  • X
  • Facebookでシェアする
  • はてなブックマークに追加する
  • LINEでシェアする

コイントスで中心極限定理を理解するための GIF アニメーション

2021年06月21日 | ブログラミング

コイントスの結果は2項分布になるので,B(n, p-0.5) の n が大きくなれば正規分布に近づくというのは前に述べた。

コインの裏表を 1/0 で表して合計すると(平均値を求めても同じであるが)考えれば,一様分布に従う n 個のデータの和ということで,中心極限定理に従うことになると解釈できる。

サンプルプログラム

using Plots, PlotThemes, Random, Statistics, FreqTables

function centrallimittheorem2(nmax=20; fps=1)
    Random.seed!(12345)
    theme(:gruvbox_light)
    pyplot(grid=false, label="", size=(400, 300))
    n = 100000
    anim = @animate for i = 1:nmax
        data = vec(sum(reshape(rand(0:1, n*i), n, :), dims=2));
        height = freqtable(data);
        x = vec(names(height)...);
        height = 100*vec(height) / n
        bar(x, height, bar_width=1, linewidth=0,
            xlims=(-0.5, nmax+0.5), ylimits=(0, 55),
            tick_direction=:out, tickfontsize=10,
            xlabel="表が出た枚数", ylabel="パーセント",
            title="表が出た枚数の分布")
        annotate!(10, 53,
            text("$i 個のコインを投げるという試行を $n 回繰り返す", 8, :black))
    end
    gif(anim, "centralliittheorem2.gif", fps=fps)
end

centrallimittheorem2(20)

コメント
  • X
  • Facebookでシェアする
  • はてなブックマークに追加する
  • LINEでシェアする

サイコロ投げで中心極限定理を理解するための GIF アニメーション

2021年06月21日 | ブログラミング

毎回,サイコロを1個だけ投げて出た目を記録して棒グラフを描くと,1 ~ 6 の目はほぼ均等に出る(矩形分布になる)ことがわかる。

毎回,サイコロを2個投げて出た目の平均値を求め記録して棒グラフを描くと,分布は三角分布になることがわかる。

毎回,サイコロを3, 4, 5, ..., n個投げて出た目の平均値を求め記録して棒グラフを描くと,分布はだんだん正規分布に近くなることがわかる。

出目の平均値は 3.5 程度で,分散が小さくなる。

以下の図の縦軸は確率密度である。

シミュレーションプログラムは以下の通り。

using Plots, PlotThemes Random, Statistics, FreqTables

function centrallimittheorem(nmax=20; fps=1)
    Random.seed!(12345)
    theme(:gruvbox_light)
    pyplot(grid=false, label="", size=(400, 300))
    n = 100000
    anim = @animate for i = 1:nmax
        data = vec(mean(reshape(rand(1:6, n*i), n, :), dims=2));
        height = freqtable(data);
        x = vec(names(height)...);
        width = minimum(diff(x));
        height = vec(height) / (n*width)
        bar(x, height, bar_width=width, linewidth=0,
            xlims=(0.5, 6.5), ylims=(0, 1.2),
            tick_direction=:out, tickfontsize=10,
            xlabel="出目の平均値", ylabel="密度",
            title="出目の平均値の分布")
        annotate!(3.5, 1.1,
            text("$i 個のサイコロを投げるという試行を $n 回繰り返す", 8, :black))
    end
    gif(anim, "centralliittheorem.gif", fps=fps)
end

centrallimittheorem(20)

コメント
  • X
  • Facebookでシェアする
  • はてなブックマークに追加する
  • LINEでシェアする

t 分布の概形を示す GIF アニメーション

2021年06月21日 | ブログラミング

自由度が∞の場合は,正規分布である。

自由度が1の場合はコーシー分布で,見た目からは信じられないだろうが,平均値は定義されない。

using Plots, PlotThemes, Rmath

function tdistribution(;fps=10)
    x = -4:0.1:4
    theme(:gruvbox_light)
    pyplot(grid=false, label="", size=(400, 300))
    nyu = vcat([1:10, 20, 50, 100, 500, 1000, Inf]...)
    append!(nyu, reverse(nyu))
    anim = @animate for ν in nyu
        plot(x, dt.(x, ν), color=:black, alpha=0.8,
            tick_direction=:out, tickfontsize=10,
            xlims=(-4, 4), ylims=(0, 0.4), xlabel="\$t\$",
            ylabel="\$f(t;ν)\$: Probability density function",
            title="t distribution")
        annotate!(0, 0.05, text("ν = $ν", 10, :black))
    end
    gif(anim, "tdistribution.gif", fps=fps)
end

tdistribution()


コメント
  • X
  • Facebookでシェアする
  • はてなブックマークに追加する
  • LINEでシェアする

F 分布の概形を示す GIF アニメーション

2021年06月21日 | ブログラミング

第1自由度が 1, 2 のときはそれ以外の場合と形が違う。

以下がプログラム。

using Plots, PlotThemes, Rmath

function fdistribution(;fps=5)
    x = 0:0.05:7
    theme(:gruvbox_dark)
    pyplot(grid=false, label="", size=(400, 300))
    anim = @animate for ν1 = 1:10, ν2 = 1:10
        plot(x, df.(x, ν1, ν2), color=:yellow, alpha=0.8,
            tick_direction=:out, tickfontsize=10,
            xlims=(0, 7), ylims=(0, 1), xlabel="\$x\$",
            ylabel="\$f(x;ν1,ν2)\$: Probability density function",
            title="F distribution")
        annotate!(4, 0.2, text("ν1 = $ν1, ν2 = $ν2", :left, 10, :white))
    end
    gif(anim, "fdistribution.gif", fps=fps)
end

fdistribution()

コメント
  • X
  • Facebookでシェアする
  • はてなブックマークに追加する
  • LINEでシェアする

χ2分布の概形を示す GIF アニメーション

2021年06月21日 | ブログラミング

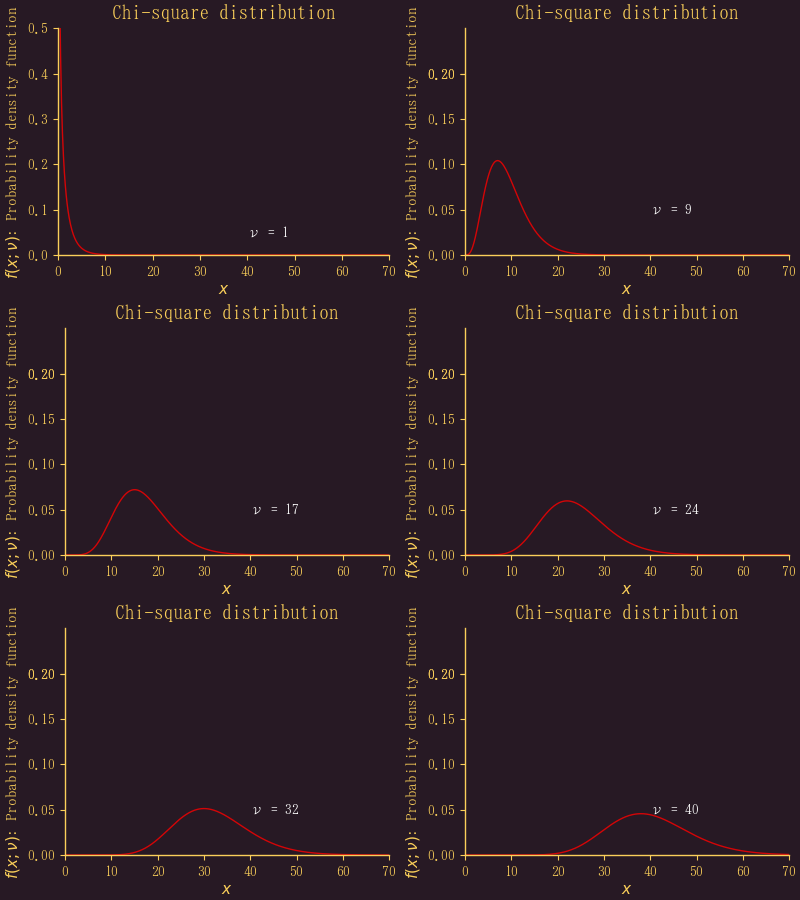
自由度が 1, 2 のときは形がちょっと違う。

作成するプログラムは以下の通り。

using Plots, PlotThemes, Rmath

function chisquaredistribution(;fps=2)
    x = 0:0.1:100
    theme(:orange)
    pyplot(grid=false, label="", size=(400, 300))
    anim = @animate for ν = 1:40
        plt = plot(x, dchisq.(x, ν), color=:red, alpha=0.8,
            tick_direction=:out, tickfontsize=10,
            xlims=(0, 70), ylims=(0, ν <= 2 ? 0.5 : 0.25), xlabel="\$x\$",
            ylabel="\$f(x;ν)\$: Probability density function",
            title="Chi-square distribution")
        plt1 = annotate!(40, 0.05, text("ν = $ν", :left, 10, :white))
    end
    gif(anim, "chisquaredistribution.gif", fps=fps)
end

chisquaredistribution()

コメント
  • X
  • Facebookでシェアする
  • はてなブックマークに追加する
  • LINEでシェアする

標準正規分布の確率密度関数と分布関数を GIF アニメーションで表示する

2021年06月21日 | ブログラミング

収穫物:前の記事で,2つのグラフをまとめて gif ファイルにする方法がわからないとか,愚痴っていたけど,簡単だった。自己解決。

plt1 = foo1();
plt1 = bar1();
plt2 = baz2()
plt2 = boo()
plot(plt1, plt2, layout=(n, m))

とすればよいだけだった。

ということで,標準正規分布の確率密度関数 f(z) と 分布関数 F(z) の対応図をアニメ化した。

追記:p, 1-p の表示が間違ってました

途中の図

using Plots, PlotThemes, Rmath

function normaldistribution(; fps=7)
    round3(a) = round(a, digits=3)
    z = -3.5:0.1:4.5
    theme(:lime)
    pyplot(grid=false, label="", size=(500, 600))
    y1 = dnorm.(z)
    y2 = pnorm.(z)
    anim = @animate for i = 1:length(z)
        z[i] > 3 && break
        plt1 = plot(z, y1)
        y = dnorm.(z)
        plt1 = plot!(vcat(z[1:i], z[i]), vcat(y1[1:i], y1[1]),
            seriestype=:shape, color=:red, alpha=0.8,
            tick_direction=:out, xlims=(-3.5, 3.5), ylims=(0, 0.4),
            xlabel="\$z\$", ylabel="\$f\$: Probability density function")
        plt1 = annotate!(-3, 0.3, text(" p=$(round3(pnorm(z[i])))", :left, 10, :white))
        plt1 = annotate!(3, 0.3, text("1-p=$(round3(pnorm(z[i], false)))", :right, 10, :white))

        plt1 = annotate!(z[i], 0.05, text(" z=$(z[i])", :left, 10, :white))
        plt2 = plot(z, y2)
        plot2 = plot!([z[i], z[i], z[1]], [0, y2[i], y2[i]], arrow=true)
        plt2 = scatter!([z[i]], [y2[i]],
            tick_direction=:out, xlims=(-3.5, 3.5), ylims=(0, 1.05),
            xlabel="\$z\$", ylabel="\$F\$: Distribution function")
        plt2 = annotate!(-3, y2[i] < 0.14 ? 0.14 : y2[i]+0.05,
            text("F($(z[i]))=$(round3(y2[i]))", :left, :bottom, 10, :white))
        plt2 = annotate!(z[i], 0.12, text(" z=$(z[i])", :left, 10, :white))
        plot(plt1, plt2, layout=(2, 1))
        z[i] == 1.6 && savefig("mid.png")
    end
    gif(anim, "normaldistribution.gif", fps=fps)
end

normaldistribution(;fps=1)

コメント
  • X
  • Facebookでシェアする
  • はてなブックマークに追加する
  • LINEでシェアする

ポアソン分布が正規近似される様子を示す GIF アニメーション

2021年06月20日 | ブログラミング

ポアソン分布においては,ポアソン定数 λが大きくなるにつれ,正規分布に近づく。

ただし,二項分布が正規分布に近づくのに比べると,遅い。

最終時点での結果は以下の通り。正規分布曲線にはまだ十分近づいているとは言いがたい。

using Plots, PlotThemes, Rmathx

function poissondistribution(; fps=7)
    maxx = 40
    theme(:lime)
    pyplot(grid=false, xlims=(-0.5, maxx), ylims=(0, 0.3),
        label="", size=(400, 400))
    x2 = 0:0.1:maxx
    anim = @animate for λ = 1:0.5:floor(Int, maxx/2)
        x = 0:maxx
        y = dpois.(x, λ)
        bar(x, y, bar_width=1, color=:red, tick_direction=:out,
            xlabel="\$x\$", ylabel="\$f(x;λ)\$; probability or density")
        y2 = dnorm.(x2, λ, sqrt(λ))
        plot!(x2, y2, color=:cadetblue1,
            title="poisson distribution\nPois(x;λ=$λ)")
    end
    savefig("last.png")
    gif(anim, "poissondistribution.gif", fps=fps)
end

d = poissondistribution()

コメント
  • X
  • Facebookでシェアする
  • はてなブックマークに追加する
  • LINEでシェアする

二項分布が正規近似される様子を示す GIF アニメーション

2021年06月20日 | ブログラミング

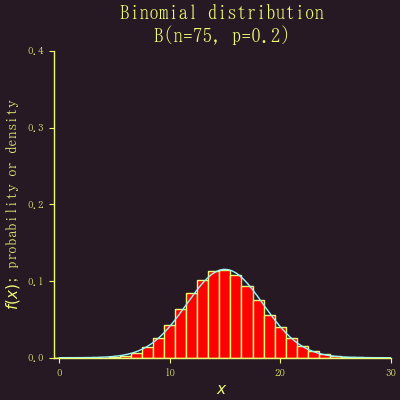
二項分布 B(n, p) において,n がそんなに大きくない場合は,p が 0.5 でないときには分布はかなり歪んでいる。しかし,n が大きくなると,だんだん正規分布に近づいていく。

その様子を示したのが以下の GIF アニメーション。最後の状態 n = 75 のときの場合を別途掲示する。

using Plots, PlotThemes, Rmath

function binomialdistribution(p; fps=7)
    maxx = 30
    theme(:lime)
    pyplot(grid=false, xlims=(-0.5, maxx), ylims=(0, 0.4),
        label="", size=(400, 400))
    x2 = 0:0.1:maxx
    anim = @animate for ni = 1:floor(Int, maxx/2p)
        x = 0:ni
        y = dbinom.(x, ni, p)
        bar(x, y, bar_width=1, color=:red, tick_direction=:out,
            xlabel="\$x\$", ylabel="\$f(x)\$; probability or density")
        y2 = dnorm.(x2, ni*p, sqrt(ni*p*(1-p)))
        plot!(x2, y2, color=:cadetblue1,
            title="Binomial distribution\nB(n=$ni, p=$p)")
    end
    savefig("last.png")
    gif(anim, "binomialdistribution.gif", fps=fps)
end

d = binomialdistribution(0.2)

コメント
  • X
  • Facebookでシェアする
  • はてなブックマークに追加する
  • LINEでシェアする

散布図とピアソンの積率相関係数の GIF アニメーション

2021年06月20日 | ブログラミング

散布図を見ただけで,ピアソンの積率相関係数のだいたいの値をいえるようになると,経験値が上がるかもしれない...

作成する Julia プログラムは以下の通り。

using LinearAlgebra, StatsBase, Statistics
using Plots, StatsPlots, PlotThemes
using Random

function pearsoncorrelationcoefficient(n)
    ρ = vcat([0:0.1:1, 0.9:-0.1:-1, -0.9:0.1:-0.1]...);
    x = randn(n, 2);
    t = fit(ZScoreTransform, x, dims = 1);
    x = StatsBase.transform(t, x);
    r = cor(x);
    solver = inv(r);
    vect, valu, junk = svd(r);
    coeff = solver * (sqrt.(valu) .* vect')';
    theme(:gruvbox_light)
    pyplot(grid=false, xlims=(-3.9, 3.9), ylims=(-3.9, 3.9),
        color=:blue, markerstrokewidth=0, alpha=0.4,
        aspect_ratio=1, label="", size=(400, 400))
    Random.seed!(12345);
    r = ones(2, 2)
    anim = @animate for ri in ρ
        r[1,2] = r[2,1] = abs(ri) == 1 ? sign(ri)*(1-eps()) : ri
        z = x * coeff * cholesky(r).U
        covellipse([0,0], r; n_std=1.96, color=:red, alpha=0.1)
        scatter!(z[:, 1], z[:, 2], showaxis=false, ticks=false,
            grid=false, title="Pearson's correlation coefficient: r")
        annotate!(0, -3.5, text("r = $ri", 10))
    end
    gif(anim, "pearsoncorrelationcoefficient.gif", fps=2)
end

d = pearsoncorrelationcoefficient(1500)

コメント
  • X
  • Facebookでシェアする
  • はてなブックマークに追加する
  • LINEでシェアする

PVアクセスランキング にほんブログ村

PVアクセスランキング にほんブログ村