陰関数で表された曲線の描画
https://blog.goo.ne.jp/r-de-r/e/ff2399cb40043afca226208e8fefaec9
の例を Octave で描いてみた。
clf;
hold on;
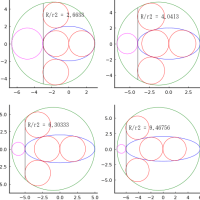
for c = [-50, -30, -20, -15, -10, 0, 1, 2, 5, 10, 20, 30, 50]
ezplot(@(x, y) (x.^2 + y.^2 - 2 .* x).^3- 4*(x .* y).^2 - c, [-1.5, 3.5, -2.5, 2.5], n=1000)
end

clf;
hold on;
for c = -10:10
ezplot(@(x, y) x.^2 - x .* y + y.^2 - c, [-4, 4], n=1000)
end