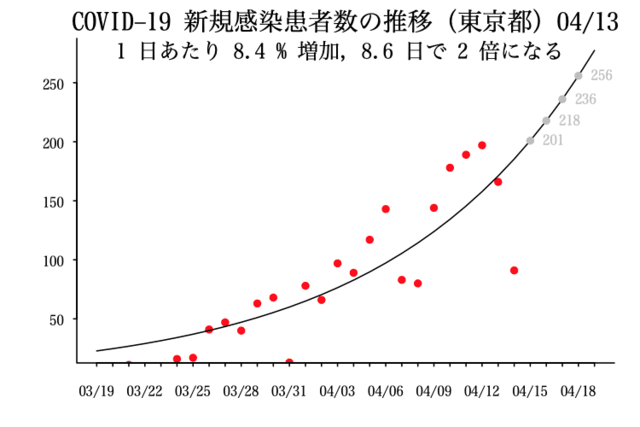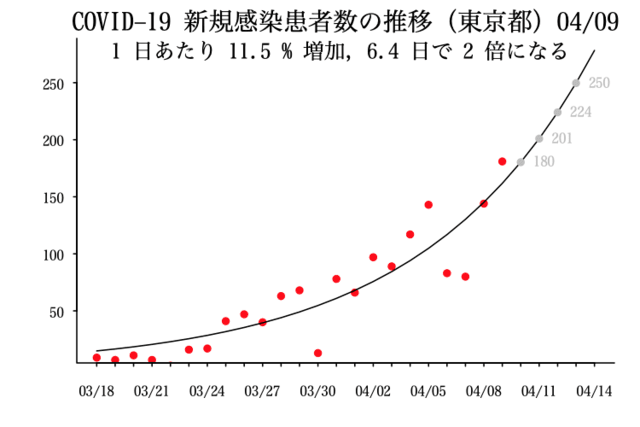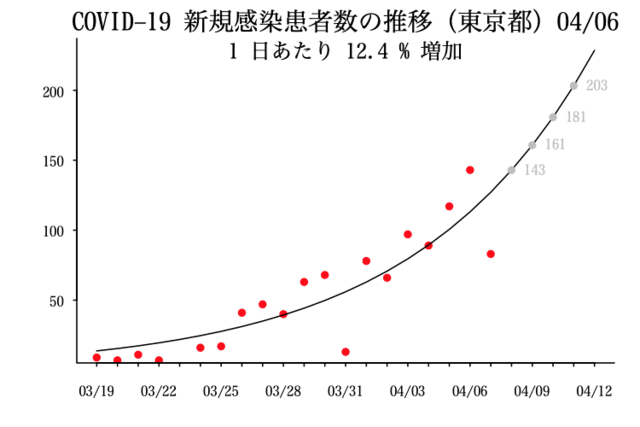
4/6 は日曜日の影響
4/7 は緊急事態宣言発表をおもんぱかってからか,作為的な数字
信頼に耐えないデータだなぁ
このデータが本当なら,緊急事態にあるとは思えない状態(^_^;)
本当なら,もう収束傾向にあるんじゃないか(^_^;)
pdf("covid-19.pdf", 360/72, 240/72, family="Japan1")
old = par(mgp=c(1, 0.5, 0), mar=c(2.5, 3, 1.5, 1), las=1, tck=-0.01, bty="l")
# 3/18 19 20 21 22 23 24 25 26 27 28 29 30 31 4/1 2 3 4 5
y = c( 9, 7, 11, 7, 2, 16, 17, 41, 47, 40, 63, 68, 13, 78, 66, 97, 89, 117, 143, 83, 80)
x = seq_along(y)
df = data.frame(x, y)
ans = nls(y ~ a*b^x, start=list(a=1, b=1))
ly = length(y)
x2 = 1:(ly+5)
df2 = data.frame(x=x2)
pred = predict(ans, newdata=df2)
plot(y ~ x, data=df, pch=19, xlim=range(x2), cex=0.7, col="red",
ylim=range(pred), ylab="", xaxt="n", xlab="", cex.axis=0.7)
lines(x2, pred)
today = Sys.Date()
param = ans$m$getPars()
for (i in 1:4) {
#lines(c(ly+i, ly+i, 0), c(0, pred[ly+i], pred[ly+i]), col="gray", lty=3)
points(ly+i, pred[ly+i], pch=19, col="gray", cex=0.7)
text(ly+i, pred[ly+i], round(param[1] * param[2]^(ly+i)), pos=4, cex=0.7, col="gray")
}
begin = today-length(x)+1
label = substr(as.Date(begin:(today+5), origin="1970-01-01"), 6, 10)
label = gsub("-", "/", label)
axis(1, at=seq_along(x2), labels=label, cex.axis=0.7)
title("COVID-19 新規感染患者数の推移(東京都)04/07")
mtext(sprintf("1 日あたり %.1f %% 増加,%.1f 日で 2 倍になる ", (param[2] - 1)*100, log(2)/log(param[2])), side=3, line=-1)
par(old)
dev.off()


