算額(その508)
秋田県仙北市角館町西長野 熊野神社 嘉永2年(1849)
http://www.wasan.jp/akita/kakunodatekumano1.html
小寺裕: 算額あれこれ
秋月めぐる,遠藤寛子: 算法少女(1),リイド社,2013.
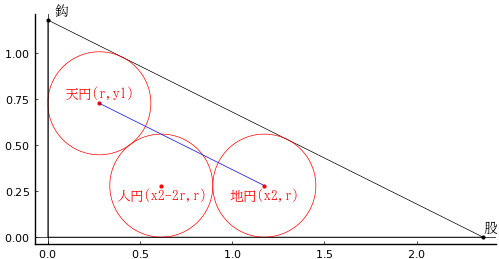
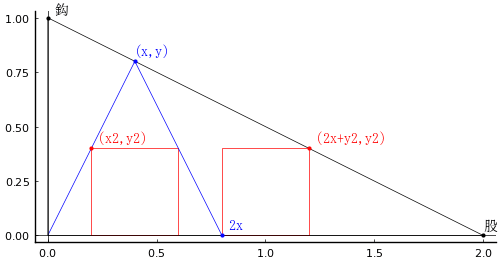
鈎股弦(直角三角形内)に二等辺三角形と 2 個の正方形が入っている。鈎の長さが 1 のとき,股の長さはいかほどか。
原点と (x,y) を結ぶ線分は,弦と直交する。
図のように記号を定め,連立方程式の数値解を求める。
include("julia-source.txt");
using SymPy
@syms 鈎::positive, 股::positive, 弦::positive, x::positive, y::positive, x2::positive, y2::positive
eq1 = y/(股 - x) - 鈎/股
eq2 = 股*鈎 - 弦*sqrt(x^2 + y^2)
eq3 = 2(x - x2) - y2
eq4 = y2/(股 - 2x -y2) - 鈎/股
eq5 = 鈎^2 + 股^2 - 弦^2
eq6 = y/x - y2/x2;
res = solve([eq1, eq2, eq3, eq4, eq5, eq7], (股, 弦, x, y, x2, y2))
using NLsolve
function nls(func, params...; ini = [0.0])
if typeof(ini) <: Number
r = nlsolve((vout, vin) -> vout[1] = func(vin[1], params..., [ini]), ftol=big"1e-40")
v = r.zero[1]
else
r = nlsolve((vout, vin)->vout .= func(vin, params...), ini, ftol=big"1e-40")
v = r.zero
end
return v, r.f_converged
end;
function H(u)
(股, 弦, x, y, x2, y2) = u
return [
y/(-x + 股) - 鈎/股, # eq1
-弦*sqrt(x^2 + y^2) + 股*鈎, # eq2
2*x - 2*x2 - y2, # eq3
y2/(-2*x - y2 + 股) - 鈎/股, # eq4
-弦^2 + 股^2 + 鈎^2, # eq5
-y2/x2 + y/x, # eq6
]
end;
鈎 = 1
iniv = BigFloat[2.0, 2.2, 0.2, 0.8, 0.1, 0.5]
res = nls(H, ini=iniv)
(BigFloat[1.999999999999999999985926409326636355492543560353991554111136639959569147152117, 2.236067977499789696396585866558016976252953289080026164208793498254395925337324, 0.3999999999999999999976356367668749077227473181394705810906711610880915130403816, 0.7999999999999999999997748225492261816878806969656638648657781909543976392427267, 0.1999999999999999999982548747565029080810754014838949527097809876602829734671478, 0.3999999999999999999987615240207439992833438333111512567617803468556170791464633], true)
股 = 2; 弦 = 2.23607; x = 0.4; y = 0.8; x2 = 0.2; y2 = 0.4
鈎の長さが 1 のとき,股の長さは 2 である。
using Plots
function draw(more=false)
pyplot(size=(500, 500), grid=false, aspectratio=1, label="", fontfamily="IPAMincho")
(股, 弦, x, y, x2, y2) = res[1]
@printf("股 = %g; 弦 = %g; x = %g; y = %g; x2 = %g; y2 = %g\n", 股, 弦, x, y, x2, y2)
plot([0, 股, 0, 0], [0, 0, 鈎, 0], color=:black, lw=0.5)
rect(x2, 0, x2 + y2, y2, :red)
rect(2x, 0, 2x + y2, y2, :red)
plot!([0, x, 2x], [0, y, 0], color=:blue, lw=0.5)
if more
delta = (fontheight = (ylims()[2]- ylims()[1]) / 500 * 10 * 2) /3 # size[2] * fontsize * 2
hline!([0], color=:black, lw=0.5)
vline!([0], color=:black, lw=0.5)
point(x, y, "(x,y)", :blue, :left, :bottom, delta=delta)
point(2x, 0, " 2x", :blue, :left, :bottom, delta=delta)
point(x2, y2, " (x2,y2)", :red, :left, :bottom, delta=delta)
point(2x + y2, y2, " (2x+y2,y2)", :red, :left, :bottom, delta=delta)
point(股, 0, "股", :black, :left, :bottom, delta=delta)
point(0, 鈎, " 鈎", :black, :left, :bottom, delta=delta/2)
else
plot!(showaxis=false)
end
end;


