裏 RjpWiki

Julia ときどき R, Python によるコンピュータプログラム,コンピュータ・サイエンス,統計学

ggplot と base(その4)

2019年12月06日 | ブログラミング

「ggplot では,容易にエラーバーのついた折れ線グラフが描けます!」っていうけど,

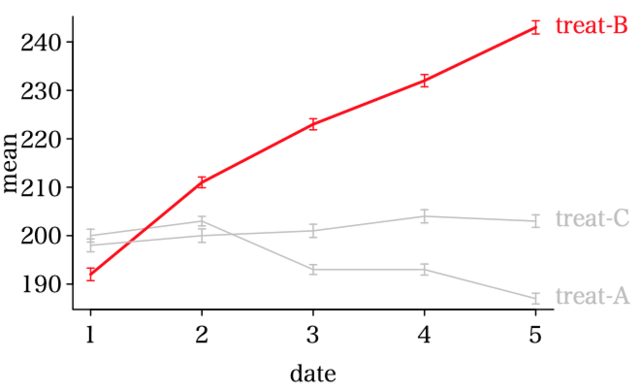
ggplot のエラーバーグラフは,エラーバーの横線が長すぎる。

ところで,そのエラーバーは標準偏差なの標準誤差なのそれともそれ以外?それを明示しないと読者を惑わす(書いてあっても,ただしく理解してもらえるかどうか怪しい)。

この図は mean ± sd で描いたもの。

R だって,エラーバー描画は arrows 関数を加えるだけで「簡単に書ける」。

以下の図は,mean ± se で描いたもの。

se = sd / sqrt(サンプルサイズ)

エラーバーの長さは,サンプルサイズが 10  でも当然だが 1/sqrt(10) ≒ 0.3 倍(ほぼ 1/3)になる。
 

library(ggplot2)
library(ggsci)

x <- data.frame(
    date = c(1, 2, 3, 4, 5,
             1, 2, 3, 4, 5,
             1, 2, 3, 4, 5),
    treat = c("A", "A", "A", "A", "A",
              "B", "B", "B", "B", "B",
              "C", "C", "C", "C", "C"),
    mean = c(200, 203, 193, 193, 187,
             192, 211, 223, 232, 243,
             198, 200, 201, 204, 203),
    sd = c(4.2, 3.1, 3.2, 3.6, 3.5,
           4.1, 3.5, 3.6, 4.0, 4.3,
           4.2, 4.4, 4.3, 4.3, 4.1)
)


ggplot(x, aes(x = date, y = mean, color = treat)) +
    geom_line() +
    scale_color_nejm() +
    geom_errorbar(aes(ymin = mean - sd, ymax = mean + sd, width = 0.3))


###################

mean = matrix(c(200, 203, 193, 193, 187,
                192, 211, 223, 232, 243,
                198, 200, 201, 204, 203), ncol = 3)
sd = matrix(c(4.2, 3.1, 3.2, 3.6, 3.5,
              4.1, 3.5, 3.6, 4.0, 4.3,
              4.2, 4.4, 4.3, 4.3, 4.1), ncol = 3)
n = 10             # サンプルサイズ
err = sd / sqrt(n) # 標準誤差(標準偏差で描きたいときは,上で n = 1 とする)
g = ncol(mean) # 群数
d = nrow(mean) # 日数
old = par(mar = c(3, 3, 0.5, 3), mgp = c(1.8, 0.4, 0))
color = rep("gray", g)
lwd = rep(1, g)
color[2] = "red"
lwd[2] = 2
matplot(mean,
    type="l",
    col = color,    # 色
    lwd = lwd,      # 太さ
    lty = 1,        # 線種

    tck = -0.02,    # ティックマークの長さ
    las = 1,        # 縦軸目盛りを水平に
    xlab = "date",
    ylab = "mean",
    bty = "l")     # 枠は描かない
arrows(1:d, mean - err, 1:d, mean + err,
    length = 0.025, angle = 90, code = 3, col = rep(color, each = d), xpd = TRUE)
text(d + 0.05, mean[d, ], paste("treat", LETTERS[1:g], sep = "-"),
    col = color, pos = 4, xpd = TRUE)
par(old)

コメント
  • X
  • Facebookでシェアする
  • はてなブックマークに追加する
  • LINEでシェアする

ggplot と base(その3)

2019年12月06日 | ブログラミング

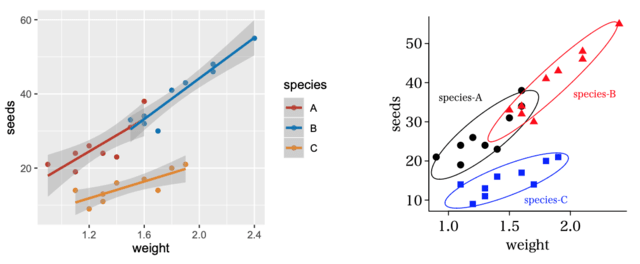
「geom_smooth 関数を使うと,回帰直線も描き込めるよ!」というが,まあ,散布図の目的のひとつは,データの撒布状況を示すのであるから,回帰直線とその信頼区間を示すよりは確率楕円を描き込むほうがよい場合もあるだろう。

なお,右図は信頼率に 0.8 を使った(0.95 では,サンプルサイズが小さい場合には楕円が大きくなりすぎる)。

library(ggplot2)
library(ggsci)

A <- data.frame(
    weight = c(1.2, 1.5, 1.1, 1.6, 1.6, 1.4, 1.3, 0.9, 1.1),
    seeds  = c(26, 31, 19, 34, 38, 23, 24, 21, 24)
)
B <- data.frame(
    weight = c(1.6, 1.7, 1.8, 1.6, 1.5, 1.9, 2.1, 2.1, 2.4),
    seeds  = c(32, 30, 41, 34, 33, 43, 46, 48, 55)
)
C <- data.frame(
    weight = c(1.1, 1.3, 1.6, 1.3, 1.2, 1.9, 1.8, 1.4, 1.7),
    seeds  = c(14, 13, 17, 11, 9, 21, 20, 16, 14)
)

x <- rbind(data.frame(species = "A", A),
           data.frame(species = "B", B),
           data.frame(species = "C", C))

quartz("ggplot", 3.5, 2.5, bg = "white")
g <- ggplot(x, aes(x = weight, y = seeds, color = species))
g <- g + geom_point()
g <- g + geom_smooth(method = "lm")
g <- g + scale_color_nejm()
print(g)

#######################

old = par(mar = c(3, 3, 0.5, 0.5), mgp = c(1.5, 0.4, 0))
x.mark = c(19, 17, 15)[as.integer(x$species)]
color = c("black", "red", "blue")
x.color = color[as.integer(x$species)]
plot(seeds ~ weight, data = x,
    pch = x.mark,  # マーク種類
    col = x.color, # 色
    tck = -0.02,   # ティックマークの長さ
    las = 1,       # 縦軸目盛りを水平に
    bty = "l")     # 枠は描かない
text(c(1.1, 2.2, 1.8), c(36, 37, 10), paste("species", LETTERS[1:3], sep = "-"),
    col = color, cex = 0.7)

Species = split(x, x$species)
for (df in Species) {
    ellipse.draw(df$weight, df$seeds, alpha = 0.2, border = color[as.integer(df[1, 1])])
}
par(old)

ggplot では作り付けなので geom_smooth(method = "lm") で済むが,base では,自前の楕円描画プログラムを用意しないといけない。

この楕円描画プログラムは「散布図,確率楕円,回帰直線,信頼限界帯,MA regression,RMA regression」にある R プログラムを使用させてもらった。

ellipse.draw <- function(x, y, alpha = 0.05, acc = 2000, border = "black", lty = 1, lwd = 1) {
    vx <- var(x)
    vy <- var(y)
    vxy <- var(x, y)
    lambda <- eigen(var(cbind(x, y)))$values
    a <- sqrt(vxy^2/((lambda[2] - vx)^2 + vxy^2))
    b <- (lambda[2] - vx) * a/vxy
    theta <- atan(a/b)
    k <- sqrt(-2 * log(alpha))
    l1 <- sqrt(lambda[1]) * k
    l2 <- sqrt(lambda[2]) * k
    x2 <- seq(-l1, l1, length.out = acc)
    tmp <- 1 - x2^2/l1^2
    y2 <- l2 * sqrt(ifelse(tmp < 0, 0, tmp))
    x2 <- c(x2, rev(x2))
    y2 <- c(y2, -rev(y2))
    s0 <- sin(theta)
    c0 <- cos(theta)
    xx <- c0 * x2 + s0 * y2 + mean(x)
    yy <- -s0 * x2 + c0 * y2 + mean(y)
    rngx <- range(c(x, xx))
    rngy <- range(c(y, yy))
    polygon(xx, yy, lty = lty, lwd = lwd, border = border)
}


コメント
  • X
  • Facebookでシェアする
  • はてなブックマークに追加する
  • LINEでシェアする

ggplot と base(その2)

2019年12月06日 | ブログラミング

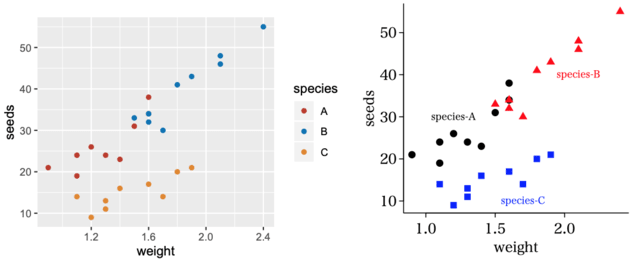
ggplot は,凡例は図の外に描く。もっと悪いことには,例え凡例が1個でも描いてしまう。

凡例も,この例のようにある程度点がまとまっているような場合には図中に描く方がわかりやすい。

デフォルトの色の選択も,よく言えば「渋い」が例えばこの図の赤っぽいのとオレンジっぽいのの区別がつきづらい。また,常にカラーで見られるのならこれでもよいが,モノクロコピーの配布物にこの図が入ってしまうとどうなるか。記号の区別は色だけではなく形状も考慮するのがよいであろう。たまたま,中央付近に赤の三角と黒丸が重なっているところがある。ggplot ではほとんど気づかない。

library(ggplot2)
library(ggsci)

A <- data.frame(
    weight = c(1.2, 1.5, 1.1, 1.6, 1.6, 1.4, 1.3, 0.9, 1.1),
    seeds  = c(26, 31, 19, 34, 38, 23, 24, 21, 24)
)
B <- data.frame(
    weight = c(1.6, 1.7, 1.8, 1.6, 1.5, 1.9, 2.1, 2.1, 2.4),
    seeds  = c(32, 30, 41, 34, 33, 43, 46, 48, 55)
)
C <- data.frame(
    weight = c(1.1, 1.3, 1.6, 1.3, 1.2, 1.9, 1.8, 1.4, 1.7),
    seeds  = c(14, 13, 17, 11, 9, 21, 20, 16, 14)
)

x <- rbind(data.frame(species = "A", A),
           data.frame(species = "B", B),
           data.frame(species = "C", C))

g <- ggplot(x, aes(x = weight, y = seeds, color = species))
g <- g + geom_point()
g <- g + scale_color_nejm()
print(g)

===============

old = par(mar = c(3, 3, 0.5, 0.5), mgp = c(1.5, 0.4, 0))
x.mark = c(19, 17, 15)[as.integer(x$species)] # マークの形状
color = c("black", "red", "blue")             # 使用する色
x.color = color[as.integer(x$species)]        # マークの色
plot(seeds ~ weight, data = x,
    pch = x.mark,  # マーク種類
    col = x.color, # 色
    tck = -0.02,   # ティックマークの長さ
    las = 1,       # 縦軸目盛りを水平に
    bty = "l")     # 枠は描かない
text(c(1.2, 2.1, 1.7), c(30, 40, 10), paste("species", LETTERS[1:3], sep = "-"),
    col = color, cex = 0.7) # 凡例の代わり

par(old)

コメント
  • X
  • Facebookでシェアする
  • はてなブックマークに追加する
  • LINEでシェアする

図を描くときに「やるべきこと」と「やってはいけないこと」(その2)

2019年12月06日 | ブログラミング

The Do’s and Don’ts of Chart Making

  • シンプルな図を描け
    • グリッドラインは描くな
    • 不要な目盛りは描くな(図の中に数値を描け)
  • 長いラベルを描くときにも,傾いたラベルを描くな(水平棒グラフにせよ)
  • 意味のある順番に描け(大小順に描け)
  • 強調したいものを強調せよ(色を変える)
 
R の barplot を以下のように使う。
 
注意点
 サブタイトルを描くために sub という引数があるが,これは formula で指定する場合にサブセットを指定する subset 引数とバッティングする。sub="xxx" と描いてもサブタイトルの指定ではなく,サブセットの指定と見なされ(当然不当な指定と見なされ)思うようなグラフが描けない。
 また,この例のようにデータを並べ替えて表示したいような場合にも,formula で指定すると並べ替えが反映されない。
 したがって,formula による指定ではなく,height, names.arg によって指定する必要がある。

                  area investment
1               Health        190
2    Youth Development        340
3              Housing        360
4 Community Betterment        620
5       Arts & Culture        630
6       Human Services        670
7    Capacity Building        710
 
df = data.frame(area = c("Arts & Culture", "Capacity Building", "Community Betterment",
    "Health", "Housing", "Human Services", "Youth Development"),
    investment = c(630, 710, 620, 190, 360, 670, 340))
o = order(df$investment) # 昇順に並べる(棒は下から積み上がるので順序に注意)
df = df[o,]
old = par(mar = c(0, 10, 2.0, 0.5), # 図の周囲の余白(下,左,上,右の順)左の余白を調整する
    mgp = c(1.8, 0.4, 0)) # ラベル,目盛り,軸が描かれる位置(単位は'行')
pos.y = barplot(df$investment, names.arg = df$area, # 並べ替えたりサブタイトルを付ける場合は formula で指定するとマズイ
    horiz = TRUE, # 水平棒グラフにする
    las = 2, # y 軸の目盛り(カテゴリー名)を水平に描く
    ylab = "", # 軸のラベルは描かない
    xaxt = "n", xlab = "", # x 軸を描かない(ラベルも描かない)
    col = rep(c("#e7924c", "#dd574c"), c(3, 4)), # 塗りつぶし色の指定(下から上への順)
    border = NA, # 境界線を描かない
    main="Investment by area of impact" # メインタイトル
    )
title(main="2006-Present / Dollars in '000s", line = 0, cex.main = 0.7) # sub タイトルは下に描かれるので,R を騙す
text(df[, 2], pos.y, paste0("$", df[, 2]), pos = 2, family = "sans", font = 2, col = "white", cex = 0.8)

で,このようなものが描ける。
 

コメント
  • X
  • Facebookでシェアする
  • はてなブックマークに追加する
  • LINEでシェアする

ggplot と base(その1)

2019年12月06日 | ブログラミング

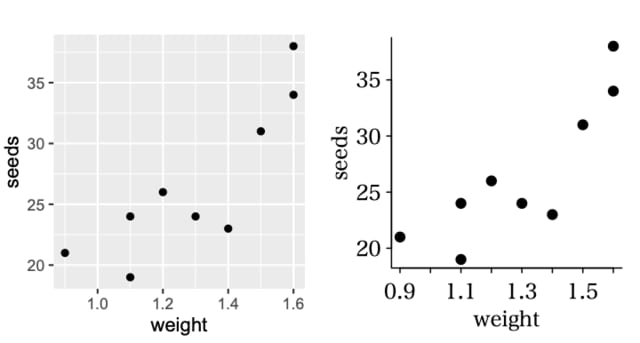
散布図の比較。他も同じなのだけど,デフォルトでバックグラウンドが灰色で白のグリッド線が入るのは,無用の長物。

x <- data.frame(
    weight = c(1.2, 1.5, 1.1, 1.6, 1.6, 1.4, 1.3, 0.9, 1.1),
    seeds  = c(26, 31, 19, 34, 38, 23, 24, 21, 24)
)

g <- ggplot(x, aes(x = weight, y = seeds))
g <- g + geom_point()
print(g)

old = par(mar = c(3, 3, 0.5, 0.5), mgp = c(1.5, 0.4, 0))
plot(seeds ~ weight, data = x, # 今の場合は plot(x, でよい
    pch = 19,    # マーク種類
    tck = -0.02, # ティックマークの長さ
    las = 1,     # 縦軸目盛りを水平に
    bty = "l")   # 枠は描かない
par(old)

コメント
  • X
  • Facebookでシェアする
  • はてなブックマークに追加する
  • LINEでシェアする

PVアクセスランキング にほんブログ村

PVアクセスランキング にほんブログ村