R version 4.0.4 Patched (2021-02-17 r80031) で確認
version.string R version 4.0.4 Patched (2021-02-17 r80031)
nickname Lost Library Book
> print("漢字の出力,問題なし!")
[1] "漢字の出力,問題なし!"
R version 4.0.4 Patched (2021-02-17 r80031) で確認
version.string R version 4.0.4 Patched (2021-02-17 r80031)
nickname Lost Library Book
> print("漢字の出力,問題なし!")
[1] "漢字の出力,問題なし!"
#===============
Julia の修行をするときに,いろいろなプログラムを書き換えるのは有効な方法だ。
以下のプログラムを Julia に翻訳してみる。
データの読み込みと前処理と可視化まで
R/plotlyの忘備録
https://qiita.com/yono2844/items/4a27f8b74dd31e20221d
元のプログラム
R"""
library(plotly)
library(lubridate)
library(dplyr)
# https://archive.ics.uci.edu/ml/datasets/water+treatment+plant
X <- read.csv(file="water-treatment.data", header=FALSE, na.strings="?")
X <- na.omit(X)
X <- X %>% mutate(V1=dmy(X$V1)) %>% arrange(V1)
X <- X %>% mutate_if(is.numeric, scale) %>% mutate_if(is.numeric, as.numeric)
# line-plot
fig <- plot_ly(x=X$V1, y=X$V2, type="scatter", mode="lines", name="V2")
fig <- fig %>% add_trace(x=X$V1, y=X$V3, name="V3")
fig <- fig %>% add_trace(x=X$V1, y=X$V4, name="V4")
fig <- fig %>% add_trace(x=X$V1, y=X$V5, name="V5")
fig <- fig %>% layout(
xaxis=list(title="Date"),
yaxis=list(title="Value"))
fig
# Histogram
fig <- plot_ly(x=X$V2, type="histogram")
fig <- fig %>% layout(
xaxis=list(title="V2"),
yaxis=list(title="Count")
)
fig
"""
翻訳するときに書いたメモ
なかなか,癖の強いデータファイルである。
dplyr が絡むとなおさら。
x.v1 の変換は,以下のようにしてもよいが,
#x.v1 = replace.(x.v1, "D-"=>"");
#x.v1 = replace.(x.v1, "/90"=>"/1990");
#x.v1 = replace.(x.v1, "/91"=>"/1991");
#x.v1 = Date.(x.v1, DateFormat("d/m/yy")); # 日付データに変換
getdate() を定義するとよい。
x.v1 = getdate.(x.v1)
正規化も for -- end で実質 1 行で書ける。
===============#
using CSV, DataFrames, Dates, StatsBase, Plots
plotly()
function getdate(s)
a = split.(s, r"[-/]")
Date(Dates.Year("19"*a[4]), Dates.Month(a[3]), Dates.Day(a[2]))
end
# 欠損値が "?" missingstring="?"
# 整数データがある typemap=Dict(Int => Float64) # Julia 特有か(実数に変換しなければ問題ない)
# ヘッダーがない header="v" .* string.(1:39)
x = CSV.read("water-treatment.data", DataFrame, missingstring="?",
typemap=Dict(Int => Float64), header="v" .* string.(1:39));
x = dropmissing(x); # 欠損値のある行を削除
x.v1 = getdate.(x.v1); # 日付データの整形
sort!(x, :v1); # しかも日付がソートされていないのでソートする
A = Matrix(x[:, 2:39]); # 正規化
temp = fit(ZScoreTransform, A, dims=1);
x[:, 2:39] = StatsBase.transform(temp, A);
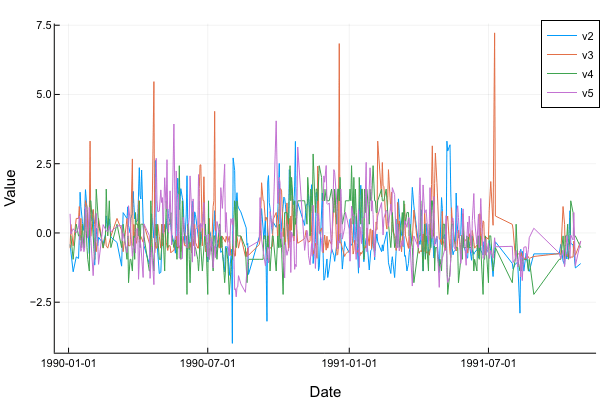
p = plot(x.v1, x.v2, xlabel="Date", ylabel="Value", label="v2");
p = plot!(x.v1, x.v3, label="v3");
p = plot!(x.v1, x.v4, label="v4");
p = plot!(x.v1, x.v5, label="v5")
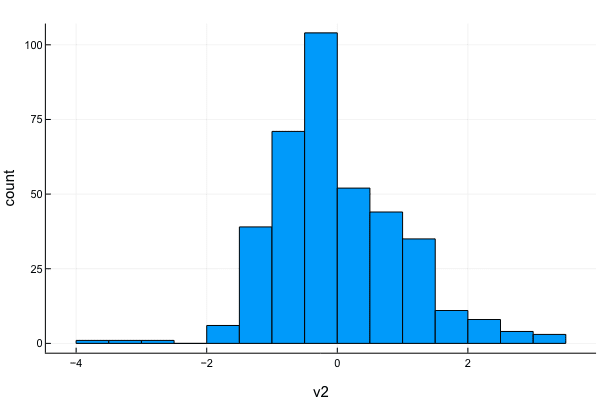
p = histogram(x.v2, xlabel="v2", ylabel="count", label="")