裏 RjpWiki

Julia ときどき R, Python によるコンピュータプログラム,コンピュータ・サイエンス,統計学

Julia で花菱をモチーフとした模様を描く(3)

2021年08月31日 | ブログラミング

Julia で花菱をモチーフとした模様を描く(3)

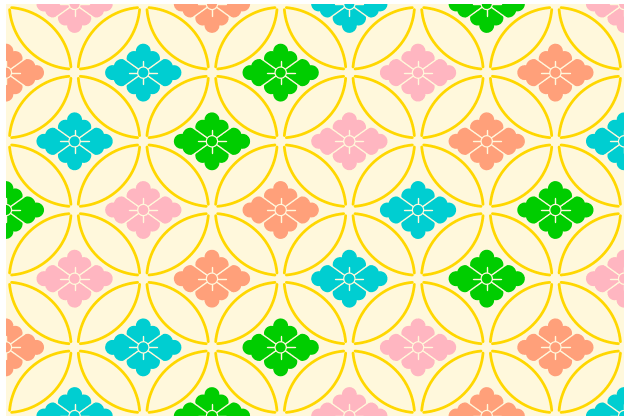
include("plotter.jl")

function hanabisi3(nx=6, ny=6; r=1, fcol1=:darkturquoise,
                   fcol2=:green3, fcol3=:lightpink,
                   fcol4=:lightsalmon,
                   backcol=:cornsilk, circlecol=:gold,
                   width=600, height=400)
    plotbegin(w=width, h=height)
    nx += 1
    ny += 3
    x1, y1, x2, y2 = 2r, r, (2nx+1)r, ny*r
    println("(width, height) = ($(x2 - x1), $(y2 - y1))")
    plotbegin(w=width, h=height)
    plotlimit(x1, y1, x2, y2)
    plotbox(x1, y1, x2, y2, lwd=0, fcol=backcol)
    r1, φ = 0.95r, 5
    for i = 1:ny
        y = i*r
        for j = 1:nx
            x = (2j + i % 2)r
            plotcircle(x, y, r1, startangle=φ, endangle=90-φ, col=circlecol, lwd=2)
            plotcircle(x, y, r1, startangle=90+φ, endangle=180-φ, col=circlecol, lwd=2)
            plotcircle(x, y, r1, startangle=180+φ, endangle=270-φ, col=circlecol, lwd=2)
            plotcircle(x, y, r1, startangle=270+φ, endangle=360-φ, col=circlecol, lwd=2)
            fcol=[fcol1, fcol2, fcol3, fcol4][(3i + j) % 4 + 1]
            hanabisi(x, y, r=0.5r, lwd=1, fcol=fcol,
                     backcol=backcol)
        end
    end
    plotend()
end

hanabisi3(4, 4, width=630, height=420)
コメント
  • X
  • Facebookでシェアする
  • はてなブックマークに追加する
  • LINEでシェアする

Julia で花菱をモチーフとした模様を描く(2)

2021年08月31日 | ブログラミング

Julia で花菱をモチーフとした模様を描く(2)

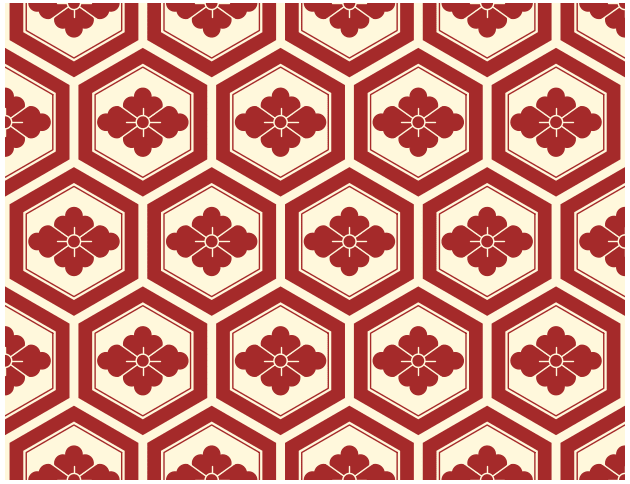
include("plotter.jl")

function hanabisi2(nx=6, ny=6; r=1, fcol=:brown,
                   backcol=:cornsilk, width=600, height=400)
    plotbegin(w=width, h=height)
    nx += 1
    ny += 2
    x1, y1, x2, y2 = 2r, r*sqrt(3), (2nx+1)r, ny*r*sqrt(3)
    println("(width, height) = ($(x2 - x1), $(y2 - y1))")
    plotbegin(w=width, h=height)
    plotlimit(x1, y1, x2, y2)
    plotbox(x1, y1, x2, y2, lwd=0, fcol=backcol)
    for i = 1:ny
        y = sqrt(3)i*r
        for j = 1:nx
            x = (2j + i % 2)r
            plotpolygon2(x, y, 1.08r, 6, φ=30, lwd=0, fcol=fcol)
            plotpolygon2(x, y, 0.85r, 6, φ=30, lwd=0, fcol=backcol)
            plotpolygon2(x, y, 0.80r, 6, φ=30, lwd=1, col=fcol)
            hanabisi(x, y, r=0.6r, lwd=1, fcol=fcol,
                     backcol=backcol)
        end
    end
    plotend()
end

hanabisi2(4, 3, width=630, height=485)

コメント
  • X
  • Facebookでシェアする
  • はてなブックマークに追加する
  • LINEでシェアする

Julia で花菱をモチーフとした模様を描く(1)

2021年08月31日 | ブログラミング

Julia で花菱をモチーフとした模様を描く(1)

include("plotter.jl")

以下の関数は単位としての花菱を1つ描く

function hanabisi(x, y; r=1, lwd=2, fcol=:black, backcol=:white, frame=false, framecol=:red)
    u = r / 280
    tangent = 5/7
    plotcircle(x + 250u, y, 55u, col=fcol, fcol=fcol)
    plotcircle(x - 250u, y, 55u, col=fcol, fcol=fcol)
    plotcircle(x + 175u, y + 45u, 60u, col=fcol, fcol=fcol)
    plotcircle(x - 175u, y + 45u, 60u, col=fcol, fcol=fcol)
    plotcircle(x + 175u, y - 45u, 60u, col=fcol, fcol=fcol)
    plotcircle(x - 175u, y - 45u, 60u, col=fcol, fcol=fcol)
    plotcircle(x + 75u, y + 115u, 55u, col=fcol, fcol=fcol)
    plotcircle(x - 75u, y + 115u, 55u, col=fcol, fcol=fcol)
    plotcircle(x + 75u, y - 115u, 55u, col=fcol, fcol=fcol)
    plotcircle(x - 75u, y - 115u, 55u, col=fcol, fcol=fcol)
    plotcircle(x, y + 175u, 55u, col=fcol, fcol=fcol)
    plotcircle(x, y - 175u, 55u, col=fcol, fcol=fcol)
    plotpolygon(x .+ [0u, 127u, 0u, -127u], y .+ [0u, 95u, 175u, 95u],
                lwd=0, fcol=fcol)
    plotpolygon(x .+ [0u, 127u, 0u, -127u], y .+ [0u, -95u, -175u, -95u],
                lwd=0, fcol=fcol)
    plotpolygon(x .+ [0u, 129u, 250u, 129u], y .+ [0u, 86u, 0u, -86u],
                lwd=0, fcol=fcol)
    plotpolygon(x .+ [0u, -129u, -250u, -129u], y .+ [0u, -86u, 0u, 86u],
                lwd=0, fcol=fcol)
    plotline(x + 175u, y + 125u, x - 175u, y - 125u, lwd=lwd, col=backcol)
    plotline(x + 175u, y - 125u, x - 175u, y + 125u, lwd=lwd, col=backcol)
    plotline(x, y + 95u, x, y - 95u, lwd=lwd, col=backcol)
    plotline(x+ 115u, y, x - 115u, y, lwd=lwd, col=backcol)
    plotcircle(x, y, 45u, col=backcol, fcol=backcol)
    plotcircle(x, y, 35u, col=fcol, fcol=fcol)
    if frame
        d = 1120/3
        plotpolygon(x .+ [d*u, 0, -d*u, 0],
                    y .+ [0, d*tangent*u, 0, -d*tangent*u],
                    lwd=0.5, col=:red)
    end
end

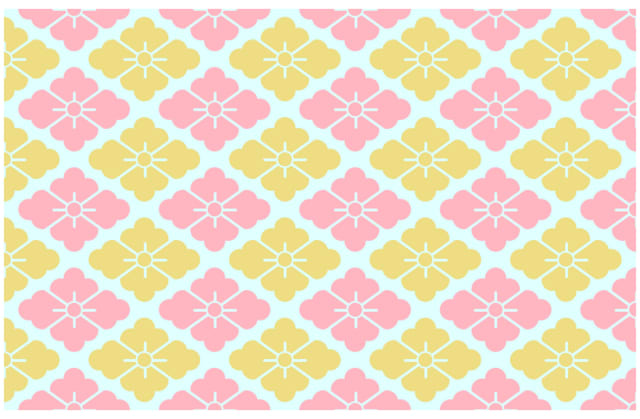
パラメータの設定で2通りの花菱模様を描くプログラム。

function hanabisi1(nx=6, ny=6; r=1, fcol1=:lightpink,
                   fcol2=:lightgoldenrod, backcol=:lightcyan,
                   frame=false, framecol=:red, width=600, height=400)
    plotbegin(w=width, h=height)
    nx += 1
    ny = 2ny + 1
    tangent = 5/7
    x1, y1, x2, y2 = 2r, tangent*r, (2nx+1)r, tangent*ny*r
    println("(width, height) = ($(x2 - x1), $(y2 - y1))")
    plotbegin(w=width, h=height)
    plotlimit(x1, y1, x2, y2)
    plotbox(x1, y1, x2, y2, lwd=0, fcol=backcol)
    for i = 1:ny
        for j = 1:nx
            hanabisi(2j + i % 2, tangent*i, r=0.72,
                 fcol=i % 2 == 1 ? fcol1 : fcol2, backcol=backcol,
                 frame=frame, framecol=framecol)
        end
    end
    plotend()
end

hanabisi1(4, 4, width=650, height=426)

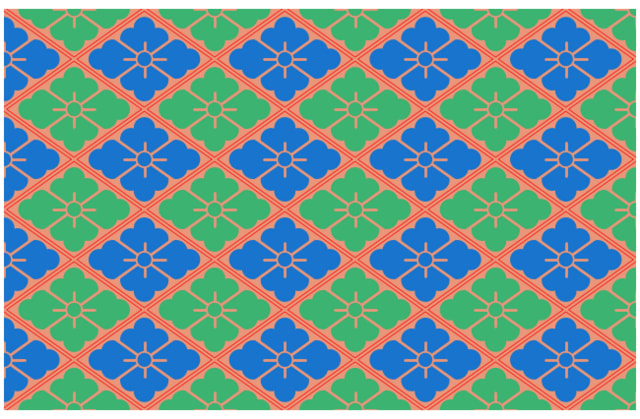
hanabisi1(4, 4, fcol1=:mediumseagreen, fcol2=:dodgerblue3,
          backcol=:darksalmon, frame=true, framecol=:white,
          width=650, height=426)

コメント
  • X
  • Facebookでシェアする
  • はてなブックマークに追加する
  • LINEでシェアする

PVアクセスランキング にほんブログ村

PVアクセスランキング にほんブログ村