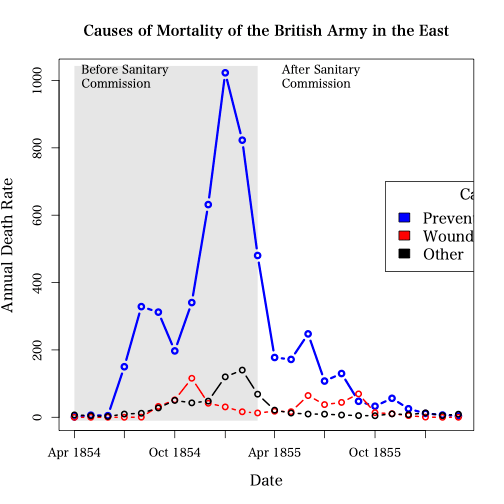
ナイチンゲールの鶏頭図よりは折れ線グラフ...という R のプログラムも,あまり良くない気がして,Julia で書いて(描いて)みた。
R の example(Nightingale) の図

折れ線に重ねるデータポイントが,文字通り「間が抜けている」
Julia で描いた図。自画自賛。

using RDatasets, DataFrames
Nightingale = dataset("HistData", "Nightingale");
using Plots
function line(x, y, col, legend)
plot!(x, y, color=col, label=legend)
scatter!(x, y, markersize=3, color=col)
end
using Dates
function linechart(df)
gr(grid=false, tick_direction=:out, titlefont=(11, "times"),
guidefont=(10, "times"), tickfont=(8, "times"),
markerstrokewidth=0, fontfamily=(8, "serif"),
foreground_color_legend=nothing, label="")
tmtick = Date(1854, 4):Month(6):Date(1856, 3)
tmticks = Dates.format.(tmtick, "u yyyy")
plot(title="Causes of Mortality of the British Army in the East",
xlabel="Month/Year", ylabel="Annual Death Rate",
xticks=(tmtick, tmticks), xminorticks=6)
line(df.Date, df.DiseaseRate, :blue, "Preventable disease")
line(df.Date, df.WoundsRate, :red, "Wounds and injuries")
line(df.Date, df.OtherRate, :black, "Other")
plot!(df.Date[[1, 12, 12, 1]], [0, 0, 1100, 1100],
seriestype=:shape, fillcolor="gray10", alpha=0.04, legend=:right)
annotate!(df.Date[1], 1000, text("Before Sanitary Commission", "times", :left, 10))
annotate!(df.Date[13], 1000, text("After Sanitary Commission", "times", :left, 10))
end
linechart(Nightingale)


> matplot(Nightingale[,1], Nightingale[,8:10], type="b", pch=16, col=c(4,2,1), xlab="Date", ylab="Annual Death Rate")
> legend("right", pch=16, col=c(4,2,1), lty=1, legend=c("Disease", "Wound", "Other"), title="Causes")
の2行だけで(後でrect()は追加するにしても)描けます