算額(その463)
埼玉県秩父市大宮 秩父神社 明治20年(1887)
山口正義(2015): やまぶき, 第27号
https://yamabukiwasan.sakura.ne.jp/ymbk27.pdf
九三 秩父市大宮 秩父神社 明治20年(1887)
一〇一 大宮市高鼻町 氷川神社 明治31年(1898)
埼玉県立図書館:埼玉県史料集 第二集『埼玉の算額』,昭和44年,誠美堂印刷所,埼玉県与野市.
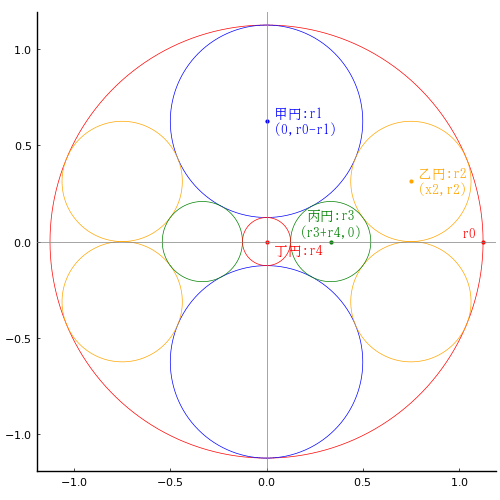
大円内に甲円 2 個,乙円 4 個,丙円 2 個,丁円 1 個が入っている。甲円の直径が 1 寸のとき,乙円の直径はいかほどか。

大円の半径と中心座標を r0, (0, 0)
甲円の半径と中心座標を r1, (0, r0 - r1)
乙円の半径と中心座標を r2, (x2, r2)
丙円の半径と中心座標を r3, (r3 + r4, 0)
乙円の半径と中心座標を r4, (0, 0)
として以下の連立方程式を解く。
include("julia-source.txt")
using SymPy
@syms r0::positive, r1::positive, r2::positive, x2::positive,
r3::positive, r4::positive;
eq1 = x2^2 + r2^2 - (r0 - r2)^2
eq2 = x2^2 + (r0 - r1 - r2)^2 - (r1 + r2)^2
eq3 = (r3 + r4)^2 + (r0 - r1)^2 - (r1 + r3)^2
eq4 = (x2 - (r3 + r4))^2 + r2^2 - (r2 + r3)^2
eq5 = r4 + 2r1 - r0
res = solve([eq1, eq2, eq3, eq4, eq5], (r0, r2, x2, r3, r4))
1-element Vector{NTuple{5, Sym}}:
(9*r1/4, 5*r1/8, 3*r1/2, 5*r1/12, r1/4)
乙円の直径は甲円の直径の 5/8 である。
すなわち甲円の直径が 1 寸のとき,乙円の直径は 5/8 = 0.625 = 6分2厘5毛である。
r0 = 1.125; r1 = 0.5; r2 = 0.3125; x2 = 0.75; r3 = 0.208333; r4 = 0.125
甲円の直径 = 1; 乙円の直径 = 0.625
using Plots
function draw(more=false)
pyplot(size=(500, 500), grid=false, aspectratio=1, label="", fontfamily="IPAMincho")
r1 = 1/2
(r0, r2, x2, r3, r4) = (9*r1/4, 5*r1/8, 3*r1/2, 5*r1/12, r1/4)
@printf("r0 = %g; r1 = %g; r2 = %g; x2 = %g; r3 = %g; r4 = %g\n", r0, r1, r2, x2, r3, r4)
@printf("甲円の直径 = %g; 乙円の直径 = %g\n", 2r1, 2r2)
plot()
circle(0, 0, r0)
circle(0, r0 - r1, r1, :blue)
circle(0, r1 - r0, r1, :blue)
circle4(x2, r2, r2, :orange)
circle(r3 + r4, 0, r3, :green)
circle(-r3 - r4, 0, r3, :green)
circle(0, 0, r4)
if more
delta = (fontheight = (ylims()[2]- ylims()[1]) / 500 * 10 * 2) / 3 # size[2] * fontsize * 2
point(0, r0 - r1, " 甲円:r1\n (0,r0-r1)", :blue, :left, :vcenter)
point(x2, r2, " 乙円:r2\n (x2,r2)", :orange, :left, :vcenter)
point(r3 + r4, 0, "丙円:r3\n(r3+r4,0)", :green, :center, :bottom, delta=delta/2)
point(0, 0, " 丁円:r4", :red, :left, :top, delta=-delta/2)
point(r0, 0, "r0 ", :red, :right, :bottom, delta=delta/4)
hline!([0], color=:gray, lw=0.5)
vline!([0], color=:gray, lw=0.5)
else
plot!(showaxis=false)
end
end;


