R の bincombinations()
R の bincombinations(p) は,0/1 からなる 2^p 個の長さ p のベクトルを生成する。
Julia に移植すると以下のようになる。
function bincombinations(p)
ary = Array{Int,2}(undef, 2^p, p);
for n = 1:p
ary[:, n] = repeat(vcat(fill(0, 2^(p - n)), fill(1, 2^(p - n))), 2^(n-1))
end
ary
end
p = 3 のときは,以下のような 2^p 行 p 列の行列を返す。
bincombinations(3)
8×3 Matrix{Int64}:
0 0 0
0 0 1
0 1 0
0 1 1
1 0 0
1 0 1
1 1 0
1 1 1
行ベクトルは,長さが p で,全ての 0/1 の出現パターンを返す。
例えば,長さが p の場合に,各行の 0 の個数が偶数であるのは何通りあるかというような問題を解くときに利用することができる。
function f(p)
ary = bincombinations(p)
sum(sum(ary, dims=2) .% 2 .== 0)
end
f(5) # 16
Julia では,`Iterators.product` を使うのが普通かも知れない。
1 つの方法は,`Iterators.product` を使うが,実際にメモリ上に上述のような行列を作る。
function f2(p)
all_perm(x, n) = vec(map(collect, Iterators.product(ntuple(_ -> x, n)...)))
count = 0
for i in all_perm([0, 1], p)
count += sum(i) % 2 == 0
end
count
end
f2(5) # 16
もう 1 つの方法では,実際にメモリ上に行列を作らない。
function f3(p)
all_perm(x, n) = Iterators.product([x for i = 1:n]...)
count = 0
for i in all_perm([0, 1], p)
count += sum(i) % 2 == 0
end
count
end
f3(5) # 16
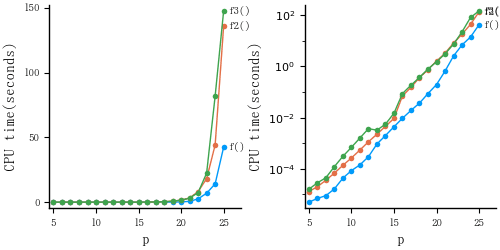
いずれも p = 20 程度までは,数秒で答えが得られる。
しかし,p が 23 にもなると,`f2()` と `f3()` は相当な時間を要することになる。
もともとは,メモリー上に作らないのでメモリー節約ということであっただろうが,1要素(1行)ごとに処理しているのもあって時間が掛かるのであろう。
どうせ,p はそんなに大きくないのだから,メモリー上に行列を前もって作る `f()` のほうが優れていると結論できるであろう。
p を 5〜25 として,各関数ごとに 10 回ずつ処理時間を計測し,その中央値を図に描くと以下のようになった。
CPUtime = [
5 5.00E-06 1.30E-05 1.60E-05
6 7.00E-06 2.00E-05 2.85E-05
7 9.00E-06 3.60E-05 4.50E-05
8 1.65E-05 6.85E-05 0.0001225
9 4.35E-05 0.0001375 0.0003095
10 8.55E-05 0.0002665 0.0006935
11 0.000143 0.0005445 0.0016065
12 0.0002985 0.0011415 0.0037025
13 0.0009345 0.00226 0.0032525
14 0.0020035 0.00456 0.005561
15 0.004387 0.00938 0.0148675
16 0.009444 0.0702565 0.087456
17 0.0192205 0.1532295 0.18541
18 0.0369055 0.364271 0.372975
19 0.0873515 0.757955 0.7971625
20 0.1958075 1.6105315 1.5161105
21 0.654857 3.273466 3.0952965
22 2.5566305 8.1765115 7.4054555
23 6.919126 18.127678 22.38751
24 14.1758585 44.117498 81.814251
25 42.42869 136.028486 147.6340555]
using Plots
pyplot(size=(300, 300), guidefontsize=6, label="")
plt = plot(CPUtime[:, 1], CPUtime[:, 2:4], grid=false,
tick_direction=:out, xlims=(4.5, 27), # yscale=:log10,
markershape=:circle, markersize=4, markerstrokewidth=0,
xlabel="p", ylabel="CPU time(seconds)")
annotate!.([25.5], CPUtime[21, 2:4], text.(["f()", "f2()", "f3()"], 8, :left));
plt2 = plot(CPUtime[:, 1], CPUtime[:, 2:4], grid=false,
tick_direction=:out, xlims=(4.5, 27), yscale=:log10,
markershape=:circle, markersize=4, markerstrokewidth=0,
xlabel="p", ylabel="CPU time(seconds)")
annotate!.([25.5], CPUtime[21, 2:4], text.(["f()", "f2()", "f3()"], 8, :left));
plot(plt, plt2, size=(500, 250))


