裏 RjpWiki

Julia ときどき R, Python によるコンピュータプログラム,コンピュータ・サイエンス,統計学

コイントスで中心極限定理を理解するための GIF アニメーション

2021年06月21日 | ブログラミング

コイントスの結果は2項分布になるので,B(n, p-0.5) の n が大きくなれば正規分布に近づくというのは前に述べた。

コインの裏表を 1/0 で表して合計すると(平均値を求めても同じであるが)考えれば,一様分布に従う n 個のデータの和ということで,中心極限定理に従うことになると解釈できる。

サンプルプログラム

using Plots, PlotThemes, Random, Statistics, FreqTables

function centrallimittheorem2(nmax=20; fps=1)
    Random.seed!(12345)
    theme(:gruvbox_light)
    pyplot(grid=false, label="", size=(400, 300))
    n = 100000
    anim = @animate for i = 1:nmax
        data = vec(sum(reshape(rand(0:1, n*i), n, :), dims=2));
        height = freqtable(data);
        x = vec(names(height)...);
        height = 100*vec(height) / n
        bar(x, height, bar_width=1, linewidth=0,
            xlims=(-0.5, nmax+0.5), ylimits=(0, 55),
            tick_direction=:out, tickfontsize=10,
            xlabel="表が出た枚数", ylabel="パーセント",
            title="表が出た枚数の分布")
        annotate!(10, 53,
            text("$i 個のコインを投げるという試行を $n 回繰り返す", 8, :black))
    end
    gif(anim, "centralliittheorem2.gif", fps=fps)
end

centrallimittheorem2(20)

コメント
  • X
  • Facebookでシェアする
  • はてなブックマークに追加する
  • LINEでシェアする

サイコロ投げで中心極限定理を理解するための GIF アニメーション

2021年06月21日 | ブログラミング

毎回,サイコロを1個だけ投げて出た目を記録して棒グラフを描くと,1 ~ 6 の目はほぼ均等に出る(矩形分布になる)ことがわかる。

毎回,サイコロを2個投げて出た目の平均値を求め記録して棒グラフを描くと,分布は三角分布になることがわかる。

毎回,サイコロを3, 4, 5, ..., n個投げて出た目の平均値を求め記録して棒グラフを描くと,分布はだんだん正規分布に近くなることがわかる。

出目の平均値は 3.5 程度で,分散が小さくなる。

以下の図の縦軸は確率密度である。

シミュレーションプログラムは以下の通り。

using Plots, PlotThemes Random, Statistics, FreqTables

function centrallimittheorem(nmax=20; fps=1)
    Random.seed!(12345)
    theme(:gruvbox_light)
    pyplot(grid=false, label="", size=(400, 300))
    n = 100000
    anim = @animate for i = 1:nmax
        data = vec(mean(reshape(rand(1:6, n*i), n, :), dims=2));
        height = freqtable(data);
        x = vec(names(height)...);
        width = minimum(diff(x));
        height = vec(height) / (n*width)
        bar(x, height, bar_width=width, linewidth=0,
            xlims=(0.5, 6.5), ylims=(0, 1.2),
            tick_direction=:out, tickfontsize=10,
            xlabel="出目の平均値", ylabel="密度",
            title="出目の平均値の分布")
        annotate!(3.5, 1.1,
            text("$i 個のサイコロを投げるという試行を $n 回繰り返す", 8, :black))
    end
    gif(anim, "centralliittheorem.gif", fps=fps)
end

centrallimittheorem(20)

コメント
  • X
  • Facebookでシェアする
  • はてなブックマークに追加する
  • LINEでシェアする

t 分布の概形を示す GIF アニメーション

2021年06月21日 | ブログラミング

自由度が∞の場合は,正規分布である。

自由度が1の場合はコーシー分布で,見た目からは信じられないだろうが,平均値は定義されない。

using Plots, PlotThemes, Rmath

function tdistribution(;fps=10)
    x = -4:0.1:4
    theme(:gruvbox_light)
    pyplot(grid=false, label="", size=(400, 300))
    nyu = vcat([1:10, 20, 50, 100, 500, 1000, Inf]...)
    append!(nyu, reverse(nyu))
    anim = @animate for ν in nyu
        plot(x, dt.(x, ν), color=:black, alpha=0.8,
            tick_direction=:out, tickfontsize=10,
            xlims=(-4, 4), ylims=(0, 0.4), xlabel="\$t\$",
            ylabel="\$f(t;ν)\$: Probability density function",
            title="t distribution")
        annotate!(0, 0.05, text("ν = $ν", 10, :black))
    end
    gif(anim, "tdistribution.gif", fps=fps)
end

tdistribution()


コメント
  • X
  • Facebookでシェアする
  • はてなブックマークに追加する
  • LINEでシェアする

F 分布の概形を示す GIF アニメーション

2021年06月21日 | ブログラミング

第1自由度が 1, 2 のときはそれ以外の場合と形が違う。

以下がプログラム。

using Plots, PlotThemes, Rmath

function fdistribution(;fps=5)
    x = 0:0.05:7
    theme(:gruvbox_dark)
    pyplot(grid=false, label="", size=(400, 300))
    anim = @animate for ν1 = 1:10, ν2 = 1:10
        plot(x, df.(x, ν1, ν2), color=:yellow, alpha=0.8,
            tick_direction=:out, tickfontsize=10,
            xlims=(0, 7), ylims=(0, 1), xlabel="\$x\$",
            ylabel="\$f(x;ν1,ν2)\$: Probability density function",
            title="F distribution")
        annotate!(4, 0.2, text("ν1 = $ν1, ν2 = $ν2", :left, 10, :white))
    end
    gif(anim, "fdistribution.gif", fps=fps)
end

fdistribution()

コメント
  • X
  • Facebookでシェアする
  • はてなブックマークに追加する
  • LINEでシェアする

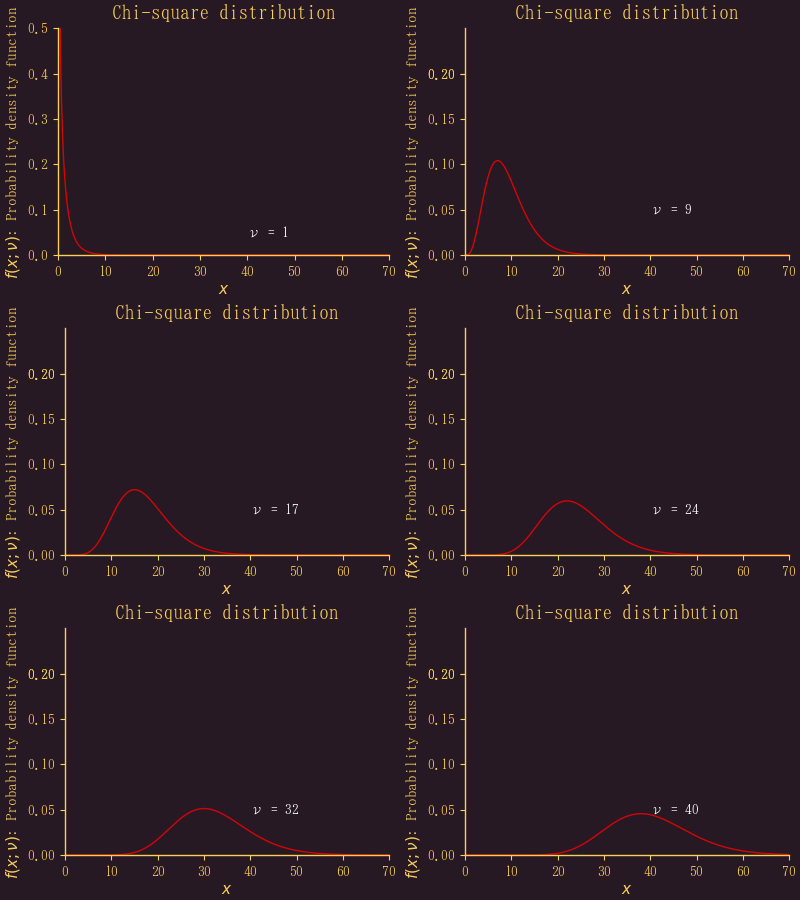
χ2分布の概形を示す GIF アニメーション

2021年06月21日 | ブログラミング

自由度が 1, 2 のときは形がちょっと違う。

作成するプログラムは以下の通り。

using Plots, PlotThemes, Rmath

function chisquaredistribution(;fps=2)
    x = 0:0.1:100
    theme(:orange)
    pyplot(grid=false, label="", size=(400, 300))
    anim = @animate for ν = 1:40
        plt = plot(x, dchisq.(x, ν), color=:red, alpha=0.8,
            tick_direction=:out, tickfontsize=10,
            xlims=(0, 70), ylims=(0, ν <= 2 ? 0.5 : 0.25), xlabel="\$x\$",
            ylabel="\$f(x;ν)\$: Probability density function",
            title="Chi-square distribution")
        plt1 = annotate!(40, 0.05, text("ν = $ν", :left, 10, :white))
    end
    gif(anim, "chisquaredistribution.gif", fps=fps)
end

chisquaredistribution()

コメント
  • X
  • Facebookでシェアする
  • はてなブックマークに追加する
  • LINEでシェアする

標準正規分布の確率密度関数と分布関数を GIF アニメーションで表示する

2021年06月21日 | ブログラミング

収穫物:前の記事で,2つのグラフをまとめて gif ファイルにする方法がわからないとか,愚痴っていたけど,簡単だった。自己解決。

plt1 = foo1();
plt1 = bar1();
plt2 = baz2()
plt2 = boo()
plot(plt1, plt2, layout=(n, m))

とすればよいだけだった。

ということで,標準正規分布の確率密度関数 f(z) と 分布関数 F(z) の対応図をアニメ化した。

追記:p, 1-p の表示が間違ってました

途中の図

using Plots, PlotThemes, Rmath

function normaldistribution(; fps=7)
    round3(a) = round(a, digits=3)
    z = -3.5:0.1:4.5
    theme(:lime)
    pyplot(grid=false, label="", size=(500, 600))
    y1 = dnorm.(z)
    y2 = pnorm.(z)
    anim = @animate for i = 1:length(z)
        z[i] > 3 && break
        plt1 = plot(z, y1)
        y = dnorm.(z)
        plt1 = plot!(vcat(z[1:i], z[i]), vcat(y1[1:i], y1[1]),
            seriestype=:shape, color=:red, alpha=0.8,
            tick_direction=:out, xlims=(-3.5, 3.5), ylims=(0, 0.4),
            xlabel="\$z\$", ylabel="\$f\$: Probability density function")
        plt1 = annotate!(-3, 0.3, text(" p=$(round3(pnorm(z[i])))", :left, 10, :white))
        plt1 = annotate!(3, 0.3, text("1-p=$(round3(pnorm(z[i], false)))", :right, 10, :white))

        plt1 = annotate!(z[i], 0.05, text(" z=$(z[i])", :left, 10, :white))
        plt2 = plot(z, y2)
        plot2 = plot!([z[i], z[i], z[1]], [0, y2[i], y2[i]], arrow=true)
        plt2 = scatter!([z[i]], [y2[i]],
            tick_direction=:out, xlims=(-3.5, 3.5), ylims=(0, 1.05),
            xlabel="\$z\$", ylabel="\$F\$: Distribution function")
        plt2 = annotate!(-3, y2[i] < 0.14 ? 0.14 : y2[i]+0.05,
            text("F($(z[i]))=$(round3(y2[i]))", :left, :bottom, 10, :white))
        plt2 = annotate!(z[i], 0.12, text(" z=$(z[i])", :left, 10, :white))
        plot(plt1, plt2, layout=(2, 1))
        z[i] == 1.6 && savefig("mid.png")
    end
    gif(anim, "normaldistribution.gif", fps=fps)
end

normaldistribution(;fps=1)

コメント
  • X
  • Facebookでシェアする
  • はてなブックマークに追加する
  • LINEでシェアする

PVアクセスランキング にほんブログ村

PVアクセスランキング にほんブログ村