裏 RjpWiki

Julia ときどき R, Python によるコンピュータプログラム,コンピュータ・サイエンス,統計学

ポアソン分布が正規近似される様子を示す GIF アニメーション

2021年06月20日 | ブログラミング

ポアソン分布においては,ポアソン定数 λが大きくなるにつれ,正規分布に近づく。

ただし,二項分布が正規分布に近づくのに比べると,遅い。

最終時点での結果は以下の通り。正規分布曲線にはまだ十分近づいているとは言いがたい。

using Plots, PlotThemes, Rmathx

function poissondistribution(; fps=7)
    maxx = 40
    theme(:lime)
    pyplot(grid=false, xlims=(-0.5, maxx), ylims=(0, 0.3),
        label="", size=(400, 400))
    x2 = 0:0.1:maxx
    anim = @animate for λ = 1:0.5:floor(Int, maxx/2)
        x = 0:maxx
        y = dpois.(x, λ)
        bar(x, y, bar_width=1, color=:red, tick_direction=:out,
            xlabel="\$x\$", ylabel="\$f(x;λ)\$; probability or density")
        y2 = dnorm.(x2, λ, sqrt(λ))
        plot!(x2, y2, color=:cadetblue1,
            title="poisson distribution\nPois(x;λ=$λ)")
    end
    savefig("last.png")
    gif(anim, "poissondistribution.gif", fps=fps)
end

d = poissondistribution()

コメント
  • X
  • Facebookでシェアする
  • はてなブックマークに追加する
  • LINEでシェアする

二項分布が正規近似される様子を示す GIF アニメーション

2021年06月20日 | ブログラミング

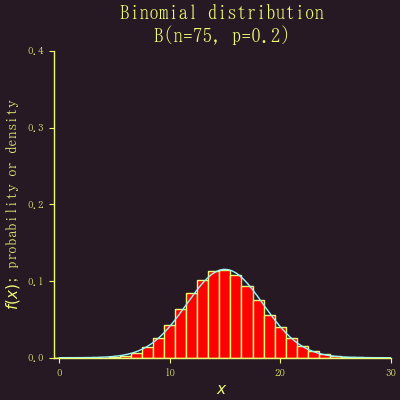
二項分布 B(n, p) において,n がそんなに大きくない場合は,p が 0.5 でないときには分布はかなり歪んでいる。しかし,n が大きくなると,だんだん正規分布に近づいていく。

その様子を示したのが以下の GIF アニメーション。最後の状態 n = 75 のときの場合を別途掲示する。

using Plots, PlotThemes, Rmath

function binomialdistribution(p; fps=7)
    maxx = 30
    theme(:lime)
    pyplot(grid=false, xlims=(-0.5, maxx), ylims=(0, 0.4),
        label="", size=(400, 400))
    x2 = 0:0.1:maxx
    anim = @animate for ni = 1:floor(Int, maxx/2p)
        x = 0:ni
        y = dbinom.(x, ni, p)
        bar(x, y, bar_width=1, color=:red, tick_direction=:out,
            xlabel="\$x\$", ylabel="\$f(x)\$; probability or density")
        y2 = dnorm.(x2, ni*p, sqrt(ni*p*(1-p)))
        plot!(x2, y2, color=:cadetblue1,
            title="Binomial distribution\nB(n=$ni, p=$p)")
    end
    savefig("last.png")
    gif(anim, "binomialdistribution.gif", fps=fps)
end

d = binomialdistribution(0.2)

コメント
  • X
  • Facebookでシェアする
  • はてなブックマークに追加する
  • LINEでシェアする

散布図とピアソンの積率相関係数の GIF アニメーション

2021年06月20日 | ブログラミング

散布図を見ただけで,ピアソンの積率相関係数のだいたいの値をいえるようになると,経験値が上がるかもしれない...

作成する Julia プログラムは以下の通り。

using LinearAlgebra, StatsBase, Statistics
using Plots, StatsPlots, PlotThemes
using Random

function pearsoncorrelationcoefficient(n)
    ρ = vcat([0:0.1:1, 0.9:-0.1:-1, -0.9:0.1:-0.1]...);
    x = randn(n, 2);
    t = fit(ZScoreTransform, x, dims = 1);
    x = StatsBase.transform(t, x);
    r = cor(x);
    solver = inv(r);
    vect, valu, junk = svd(r);
    coeff = solver * (sqrt.(valu) .* vect')';
    theme(:gruvbox_light)
    pyplot(grid=false, xlims=(-3.9, 3.9), ylims=(-3.9, 3.9),
        color=:blue, markerstrokewidth=0, alpha=0.4,
        aspect_ratio=1, label="", size=(400, 400))
    Random.seed!(12345);
    r = ones(2, 2)
    anim = @animate for ri in ρ
        r[1,2] = r[2,1] = abs(ri) == 1 ? sign(ri)*(1-eps()) : ri
        z = x * coeff * cholesky(r).U
        covellipse([0,0], r; n_std=1.96, color=:red, alpha=0.1)
        scatter!(z[:, 1], z[:, 2], showaxis=false, ticks=false,
            grid=false, title="Pearson's correlation coefficient: r")
        annotate!(0, -3.5, text("r = $ri", 10))
    end
    gif(anim, "pearsoncorrelationcoefficient.gif", fps=2)
end

d = pearsoncorrelationcoefficient(1500)

コメント
  • X
  • Facebookでシェアする
  • はてなブックマークに追加する
  • LINEでシェアする

PVアクセスランキング にほんブログ村

PVアクセスランキング にほんブログ村