裏 RjpWiki

Julia ときどき R, Python によるコンピュータプログラム,コンピュータ・サイエンス,統計学

算額(その176)

2023年03月23日 | Julia

算額(その176)

岐阜県大垣市外野釜笛 釜笛八幡神社 慶応元年(1865)
http://ryugen3.sakura.ne.jp/toukou3/wasankibousya.PDF

第5問: 囲円を 6 個の等円で囲む。楕円の短径の端は囲円に接する。楕円の長径と短径を知って囲円の径を求めよ。

囲円の半径を r,楕円の長径,短径を a, b と置く。
⊿OAB は正三角形である。

楕円の接線 https://blog.goo.ne.jp/r-de-r/e/b19211e3045786a3a9108d7dc4f41b6d を参照。

図で,r + b = sqrt(3a^2 + b^2) である。つまり,r = sqrt(3a^2 + b^2) - b である。

using Plots

function circle(ox, oy, r, color=:red; beginangle=0, endangle=360, fill=false)
   θ = beginangle:0.1:endangle
   x = r.*cosd.(θ)
   y = r.*sind.(θ)
   if fill
       plot!(ox .+ x, oy .+ y, linecolor=color, linewidth=0.5, seriestype=:shape, fillcolor=color)
   else
       plot!(ox .+ x, oy .+ y, color=color, linewidth=0.25)
   end
end;

function point(x, y, string="", color=:green, position=:left, vertical=:top; mark=true)
   mark && scatter!([x], [y], color=color, markerstrokewidth=0)
   annotate!(x, y, text(string, 10, position, color, vertical))
end;

function segment(x1, y1, x2, y2, color=:black; linestyle=:solid, linewidth=0.5)
   plot!([x1, x2], [y1, y2], color=color, linestyle=linestyle, linewidth=linewidth)
end;

function ellipse(ox, oy, ra, rb; φ=0, beginangle=0, endangle=360,
                    color=:black, lty=:solid, lwd=0.5, fcolor="")
"""
(ox, oy) を中心,ra, rb を半径とする楕円(楕円弧)。
fcolor を指定すると塗りつぶし。
"""
   θ = beginangle:0.1:endangle
   if φ == 0
       if fcolor == ""
           plot!(ra .* cosd.(θ) .+ ox, rb .* sind.(θ) .+ oy,
                 linecolor=color, linestyle=lty, linewidth=lwd)
       else
           plot!(ra .* cosd.(θ) .+ ox, rb .* sind.(θ) .+ oy,
                 linecolor=color, linestyle=lty, linewidth=lwd,
                 seriestype=:shape, fillcolor=fcolor)
       end
   else
       x = ra .* cosd.(θ)
       y = rb .* sind.(θ)
       cosine = cosd(φ)
       sine = sind(φ)
       if fcolor == ""
           plot!(cosine .* x .- sine .* y .+ ox,
                 sine .* x .+ cosine .* y .+ oy,
                 linecolor=color, linestyle=lty, linewidth=lwd)
       else
           plot!(cosine .* x .- sine .* y .+ ox,
                 sine .* x .+ cosine .* y .+ oy,
                 linecolor=color, linestyle=lty, linewidth=lwd,
                 seriestype=:shape, fillcolor=fcolor)
       end
   end
end;

function draw(a, b, more)
    pyplot(size=(500, 500), grid=false, aspectratio=1, label="", fontfamily="IPAMincho")
   r = sqrt(3a^2 + b^2) - b
   plot()
   circle(0, 0, r, :aquamarine3, fill=true)
   for i = 120:60:420
       ellipse((r + b)cosd(i - 90), (r + b)sind(i - 90), a, b, φ = i)
   end
   if more == true
       point(0, r, " r")
       point(0, r + b, " r+b")
       point(0, 0, " O")
       segment(-7, r + b, 7, r + b)
       segment(0, 0, 12cosd(60), 12sind(60))
       segment(0, 0, -12cosd(60), 12sind(60))
       point((r + b)/sqrt(3), (r + b), " A")
       point(-(r + b)/sqrt(3), (r + b), "B ", :green, :right)
       point((r + b)cosd(30), (r + b)sind(30), "(x0,y0)")
       hline!([0], color=:black, lw=0.5)
       vline!([0], color=:black, lw=0.5)
   else
      plot!(showaxis=false)
   end
end;


コメント
  • X
  • Facebookでシェアする
  • はてなブックマークに追加する
  • LINEでシェアする

算額(その175)

2023年03月23日 | Julia

算額(その175)

岐阜県不破郡垂井町宮代 南宮大社奉納算額 天保13年
http://ryugen3.sakura.ne.jp/toukou3/wasankibousya.PDF

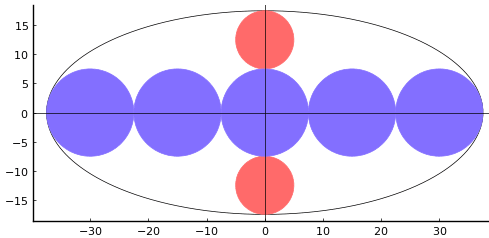
第1問: 楕円内に赤円 2 個と最も多くの青等円を奇数個入れる。赤円 2 個と青円 1 個の直径の輪は短径に等しい。また,楕円の左右の端で青円は楕円に接する。赤円と青円の径を知って,青等円の個数を求めよ。

赤円,青円の半径をそれぞれ r1, r2 とおく。以下の方程式を立てる。

using SymPy

@syms n::integer, r1::positive, r2::positive, x::positive, y::positive;
eq1 = x^2/(n*r2)^2 + y^2/(r2 + 2r1)^2 - 1
eq2 = (x -(n - 1)r2)^2 + y^2 - r2^2;

eq2 - eq1*(r2 + 2r1)^2 が (x - n*r2) の因子を持つので

eq3 = eq2 - eq1*(r2 + 2r1)^2 |> factor
eq3 |> println

   -(-n*r2 + x)*(n^3*r2^3 - 2*n^2*r2^3 - n^2*r2^2*x + 4*n*r1^2*r2 + 4*n*r1*r2^2 + n*r2^3 + 4*r1^2*x + 4*r1*r2*x + r2^2*x)/(n^2*r2^2)

除算して簡約化する。

eq4 = eq3  / (x - n*r2) |> simplify
eq4 |> println

   -n*r2 + 2*r2 + x - 4*r1^2/(n*r2) - 4*r1/n - r2/n - 4*r1^2*x/(n^2*r2^2) - 4*r1*x/(n^2*r2) - x/n^2

x = n*r2 を代入して n について解くと解が得られる。

solve(eq4(x => n*r2), n)[1] |> println

   (2*r1 + r2)^2/r2^2

なお,演算順序を変えると解が求まらないことがある。

また,r1, r2 にでたらめな数を与えると,題意に沿わない図になる場合がある。

r1 = 3, r2 = 9 のとき,青円は偶数個になる。

using Plots

function circle(ox, oy, r, color=:red; beginangle=0, endangle=360, fill=false)

   θ = beginangle:0.1:endangle
   x = r.*cosd.(θ)
   y = r.*sind.(θ)
   if fill
       plot!(ox .+ x, oy .+ y, linecolor=color, linewidth=0.5, seriestype=:shape, fillcolor=color)
   else
       plot!(ox .+ x, oy .+ y, color=color, linewidth=0.25)
   end
end;

function ellipse(ox, oy, ra, rb; φ=0, beginangle=0, endangle=360,
                    color=:black, lty=:solid, lwd=0.5, fcolor="")
"""
(ox, oy) を中心,ra, rb を半径とする楕円(楕円弧)。
fcolor を指定すると塗りつぶし。
"""
   θ = beginangle:0.1:endangle
   if φ == 0
       if fcolor == ""
           plot!(ra .* cosd.(θ) .+ ox, rb .* sind.(θ) .+ oy,
                 linecolor=color, linestyle=lty, linewidth=lwd)
       else
           plot!(ra .* cosd.(θ) .+ ox, rb .* sind.(θ) .+ oy,
                 linecolor=color, linestyle=lty, linewidth=lwd,
                 seriestype=:shape, fillcolor=fcolor)
       end
   else
       x = ra .* cosd.(θ)
       y = rb .* sind.(θ)
       cosine = cosd(φ)
       sine = sind(φ)
       if fcolor == ""
           plot!(cosine .* x .- sine .* y .+ ox,
                 sine .* x .+ cosine .* y .+ oy,
                 linecolor=color, linestyle=lty, linewidth=lwd)
       else
           plot!(cosine .* x .- sine .* y .+ ox,
                 sine .* x .+ cosine .* y .+ oy,
                 linecolor=color, linestyle=lty, linewidth=lwd,
                 seriestype=:shape, fillcolor=fcolor)
       end
   end
end;

function draw(R1, R2, more)
    pyplot(size=(500, 500), grid=false, aspectratio=1, label="", fontfamily="IPAMincho")
   (r1, r2) = (R1, R2) ./ 2
   n = floor(Int, (r2 + 2r1)^2/r2^2)
   plot()
   ellipse(0, 0, n*r2, r2 + 2r1)
   circle(0, r2 + r1, r1, :indianred1,fill=true)
   circle(0, -r2 - r1, r1, :indianred1,fill=true)
   for i = -(n - 1)//2:(n - 1)//2
       circle(2i*r2, 0, r2, :slateblue1, fill=true)
   end
   if more == true
       hline!([0], color=:black, lw=0.5)
       vline!([0], color=:black, lw=0.5)
   else
      plot!(showaxis=false)
   end
end;


コメント
  • X
  • Facebookでシェアする
  • はてなブックマークに追加する
  • LINEでシェアする

PVアクセスランキング にほんブログ村

PVアクセスランキング にほんブログ村