算額(その161)
岐阜県大垣市西外側町 大垣八幡神社 天保年間
http://ryugen3.sakura.ne.jp/toukou3/wasankibousya.PDF
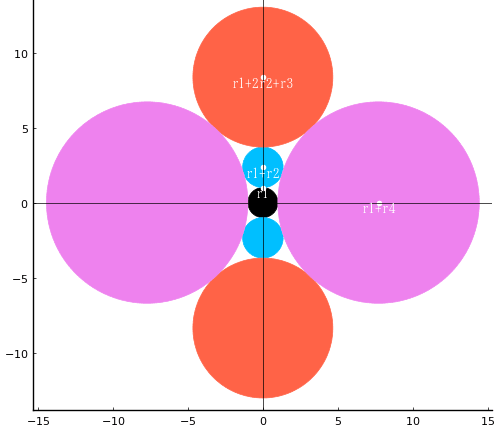
第12問: 黒円に外接する 3 個の赤円に 3 個の黃円が外接している。赤円と黒円の直径を知って黃円の直径を求めよ。

黒,赤,黃の円の半径を r1, r2, r3 とする。また,黃円の中心座標を (x3, y3) とし,連立方程式を解く。
using SymPy
@syms r1::positive, r2::positive, r3::positive, x3::positive, y3::positive;
eq1 = x3 - (r1 + r3) * cos(PI/6)
eq2 = y3 - (r1 + r3) * sin(PI/6)
eq3 = x3^2 + (r1 + r2 - y3)^2 - (r2 + r3)^2; # 赤円と黃円が外接
res = solve([eq1, eq2, eq3], (r3, x3, y3))
res |> println
Tuple{Sym, Sym, Sym}[(-r1*(r1 + r2)/(r1 - 3*r2), -2*sqrt(3)*r1*r2/(r1 - 3*r2), -2*r1*r2/(r1 - 3*r2))]
黃円の半径は -r1*(r1 + r2)/(r1 - 3*r2) つまり,「黒円の半径の二乗に黒円の半径と赤円の半径をかけたものを加え,赤円の半径の 3 倍から黒円の半径を引いたもので割る」。
using Plots
function circle(ox, oy, r, color=:red; beginangle=0, endangle=360, fill=false)
θ = beginangle:0.1:endangle
x = r.*cosd.(θ)
y = r.*sind.(θ)
if fill
plot!(ox .+ x, oy .+ y, linecolor=color, linewidth=0.5, seriestype=:shape, fillcolor=color)
else
plot!(ox .+ x, oy .+ y, color=color, linewidth=0.5)
end
end;
function point(x, y, string="", color=:green, position=:left, vertical=:top; mark=true)
mark && scatter!([x], [y], color=color, markerstrokewidth=0)
annotate!(x, y, text(string, 10, position, color, vertical))
end;
function draw(R2, R1, more)
pyplot(size=(500, 500), grid=false, aspectratio=1, label="", fontfamily="IPAMincho")
(r1, r2) = (R1, R2) ./ 2
(r3, x3, y3) = (-r1*(r1 + r2)/(r1 - 3*r2), -2*sqrt(3)*r1*r2/(r1 - 3*r2), -2*r1*r2/(r1 - 3*r2))
println("r3 = $r3; x3 = $x3; y3 = $y3")
plot()
println("黃円径 = $(2r3); 黒円径 = $R1; 赤円径 = $R2")
circle(0, 0, r1, :snow4, fill=true)
circle(0, r1 + r2, r2, :indianred1, fill=true)
circle((r1 + r2)√3/2, -(r1 + r2)/2, r2, :indianred1, fill=true)
circle(-(r1 + r2)√3/2, -(r1 + r2)/2, r2, :indianred1, fill=true)
circle(x3, y3, r3, :khaki1, fill=true)
circle(-x3, y3, r3, :khaki1, fill=true)
circle(0, -r1 - r3, r3, :khaki1, fill=true)
if more == true
point(0, r1, " r1", :white)
point(0, r1 + r2, " r1+r2", :white)
point(x3, y3, "(x3,y3,r3)", :black)
hline!([0], color=:black, lw=0.5)
vline!([0], color=:black, lw=0.5)
else
plot!(showaxis=false)
end
end;
draw(2, 2.3, false)
r3 = 1.3364864864864863; x3 = 2.153360463464009; y3 = 1.243243243243243
黃円径 = 2.6729729729729725; 黒円径 = 2.3; 赤円径 = 2


