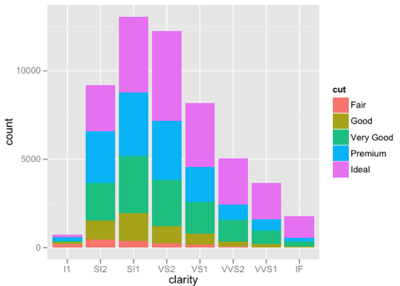
ggplot2 の geom_bar の作図例で "Stacked bar charts" の凡例とグラフの順序が逆。色使いも下品だが。
ggplot(diamonds, aes(clarity, fill=cut)) + geom_bar()

普通に barplot で描いてみよう。ちゃんと順序がそろう。
ans <- xtabs(~cut+clarity, diamonds)
col <- c("#00a0e960", "#e4007f60", "#00994460", "#f3980060", "#0068b760")
old <- par(las=1, mar=c(6, 6, 1, 1))
barplot(ans, legend=rownames(ans), col=col, xlab="clarity", ylab="count")
par(old)


