


算額(その204)
中村信弥「改訂増補 長野県の算額」
http://www.wasan.jp/zoho/zoho.html
県内の算額2(110)
長野県伊那市羽広 仲仙寺 文政9年(1826)
正方形に 4 本の斜線を引き,区分された領域に大円,中円,小円を配置する。大円の径が 1 寸のとき,小円の径はいかほどか。
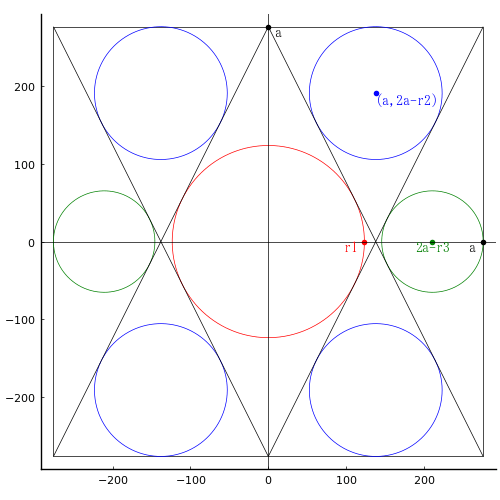
正方形の一辺の長さを 4a,大円,中円,小円の半径をそれぞれ r1, r2, r3 とおく。
各円の中心から斜線までの距離に関する方程式を立て,r について解く。
using SymPy
function distance(x1, y1, x2, y2, x0, y0)
p1, p2 = sympy.Point(x1, y1), sympy.Point(x2, y2)
l = sympy.Line(p1, p2)
l.distance(sympy.Point(x0, y0))^2 # 二乗距離を返す!!
end;
@syms r1::positive, r2::positive, r3::positive, a::positive;
eq1 = distance(0, 2a, 2a, -2a, 0, 0) - r1^2
eq2 = distance(0, 2a, 2a, -2a, a, 2a - r2) - r2^2
eq3 = distance(0, 2a, 2a, -2a, 2a - r3, 0) - r3^2
res = solve([eq1, eq2, eq3], (r2, r3, a))
1-element Vector{Tuple{Sym, Sym, Sym}}:
(-sqrt(5)*r1/4 + 5*r1/4, -2*sqrt(5)*r1 + 5*r1, sqrt(5)*r1/2)
小円の径は「大円の径 × (5 - 2√5)/4」である。
ちなみに,小円の径は「大円の径 × (5 - √5)/4」である。
r1 = 1 のとき,
r1 = 1.000; r2 = 0.691; r3 = 0.528; a = 1.118
using Plots
using Printf
function circle(ox, oy, r, color=:red; beginangle=0, endangle=360)
θ = beginangle:0.1:endangle
x = r.*cosd.(θ)
y = r.*sind.(θ)
plot!(ox .+ x, oy .+ y, color=color, linewidth=0.5)
end;
function point(x, y, string="", color=:blue, position=:left, vertical=:top; mark=true)
mark && scatter!([x], [y], color=color, markerstrokewidth=0)
annotate!(x, y, text(string, 10, position, color, vertical))
end;
function segment(x1, y1, x2, y2, color=:black; linestyle=:solid, linewidth=0.5)
plot!([x1, x2], [y1, y2], color=color, linestyle=linestyle, linewidth=linewidth)
end;
function draw(r1, more)
pyplot(size=(500, 500), grid=false, aspectratio=1, label="", fontfamily="IPAMincho")
(r2, r3, a) = (-sqrt(5)*r1/4 + 5*r1/4, -2*sqrt(5)*r1 + 5*r1, sqrt(5)*r1/2)
@printf("r1 = %.3f; r2 = %.3f; r3 = %.3f; a = %.3f\n", r1, r2, r3, a)
plot([2a, 2a, -2a, -2a, 2a], [-2a, 2a, 2a, -2a, -2a], color=:black, lw=0.5)
circle(0, 0, r1)
circle(a, 2a - r2, r2, :blue)
circle(a, r2 - 2a, r2, :blue)
circle(-a, 2a - r2, r2, :blue)
circle(-a, r2 - 2a, r2, :blue)
circle(2a - r3, 0, r3, :green)
circle(r3 - 2a, 0, r3, :green)
plot!([-2a, 0, 2a], [2a, -2a, 2a], color=:black, lw=0.5)
plot!([-2a, 0, 2a], [-2a, 2a, -2a], color=:black, lw=0.5)
if more == true
point(r1, 0, "r1 ", :red, :right)
point(a, 2a - r2, "(a,2a-r2)", :blue)
point(2a-r3, 0, "2a-r3", :green, :center)
point(2a, 0, "a ", :black, :right)
point(0, 2a, " a", :black)
hline!([0], color=:black, lw=0.5)
vline!([0], color=:black, lw=0.5)
else
plot!(showaxis=false)
end
end;


