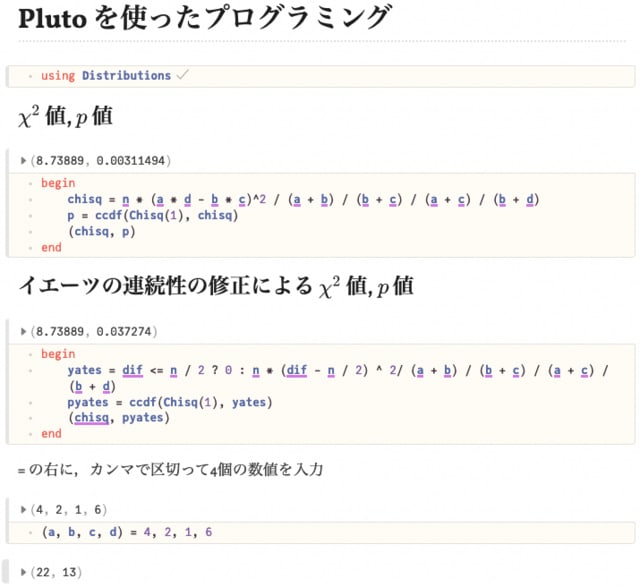
なにはともあれ,実際に見てもらいましょう。
ノートブック(Jupyter lab など)に似ているけど,プログラミング中の変数値を変えると,関連する計算式の結果も変わる。ちょうど,Excel でセルの値を変えると他のセルの結果も変わるように。
間違えたら間違った結果が出るので,どこをどう直したらどうなるかがすぐわかる。プログラミングの学習に役立つかな。
また,一度作っておけば簡易電卓みたいに入力データだけ変えて結果を得るとかにも使えそう。
コーディング部分は見えないようにもできる。

なにはともあれ,実際に見てもらいましょう。
ノートブック(Jupyter lab など)に似ているけど,プログラミング中の変数値を変えると,関連する計算式の結果も変わる。ちょうど,Excel でセルの値を変えると他のセルの結果も変わるように。
間違えたら間違った結果が出るので,どこをどう直したらどうなるかがすぐわかる。プログラミングの学習に役立つかな。
また,一度作っておけば簡易電卓みたいに入力データだけ変えて結果を得るとかにも使えそう。
コーディング部分は見えないようにもできる。

中澤先生が言及されていた NSM3:::kendall.ci() であるが,
> bootstrap=TRUEと指定すれば(B=でシミュレーション回数)ブートストラップ推定もできるというすぐれものだが、
> 欠損値対応していないこと(欠損値を含むデータを与えるとエラーになる)、
> 信頼区間だけ表示されて点推定量が表示されないこと
意外にも,プログラミング的にはダメダメなプログラムであった。最後に書き換えたプログラムを置いておくが,
欠損値対応は
ok = complete.cases(x, y)
x = x[ok]
y = y[ok]
の 3 行でできるし,
点推定量は求めているのに表示していないだけなので,cat() で書き出すだけ。
問題は,ブートストラップの部分。私の環境で example=TRUE, B=60000 でブートストラップをすると,31 秒かかった。
速度を上げるにはまず,cor.test() ではなく,以前にも書いた pcaPP の cor.fk() を使う。これで 6 秒くらいになった。
更に,毎回の結果を tau <- c(tau, tau.sample) で保存しているのだが,これは前もって必要なメモリを確保して tau[b] = tau.sample するのが定石。これで,0.865 秒になった。元の版から比べて,35 倍速になったということだ。
ちなみに,Julia で書いたら 0.06 秒なので 500 倍速だが。
誰か,原作者に教えてあげて。
# cor.test ではなく pcaPP の cor.fk を使う
library(pcaPP)
kendall.ci2 = function (x = NULL, y = NULL, alpha = 0.05, type = "t", bootstrap = FALSE,
B = 1000, example = FALSE)
{
if (example) {
x <- c(44.4, 45.9, 41.9, 53.3, 44.7, 44.1, 50.7, 45.2,
60.1)
y <- c(2.6, 3.1, 2.5, 5, 3.6, 4, 5.2, 2.8, 3.8)
}
# 欠損値対を除くために3行追加
ok = complete.cases(x, y)
x = x[ok]
y = y[ok]
n = length(x)
if (n <= 1) {
cat("\n")
cat("Sample size n must be at least two!", "\n")
cat("\n")
return # エラーなら即戻る
} else if (is.null(x) | is.null(y)) {
cat("\n")
cat("You must supply an x sample and a y sample!", "\n")
cat("\n")
return
} else if (n != length(y)) {
cat("\n")
cat("Samples must be of the same length!", "\n")
cat("\n")
return
} else if (type != "t" && type != "l" && type != "u") {
cat("\n")
cat("Argument \"type\" must be one of \"t\" (two-sided), \"l\" (lower) or \"u\" (upper)!",
"\n")
cat("\n")
return
}
Q <- function(xi, yi, xk, yk) { # 引数展開
ij <- (yk - yi) * (xk - xi)
if (ij > 0)
return(1)
if (ij < 0)
return(-1)
0
}
C.i <- function(x, y, i) {
C.i <- 0
for (k in 1:length(x)) if (k != i)
C.i <- C.i + Q(x[i], y[i], x[k], y[k])
C.i
}
# cor.test ではなく cor.fk を使う
# tau.hat <- cor.test(x, y, method = "k")$estimate
tau.hat <- cor.fk(x, y)
kendall.tau <- tau.hat # 後で結果出力するために取っておく
if (!bootstrap) {
c.i <- numeric(0)
for (i in 1:n) c.i <- c(c.i, C.i(x, y, i))
#options(warn = -1)
#options(warn = 0)
sigma.hat.2 <- 2 * (n - 2) * var(c.i)/n/(n - 1)
sigma.hat.2 <- sigma.hat.2 + 1 - (tau.hat)^2
sigma.hat.2 <- sigma.hat.2 * 2/n/(n - 1)
if (type == "t") {
z <- qnorm(alpha/2, lower.tail = FALSE)
} else { #if (type != "t")
z <- qnorm(alpha, lower.tail = FALSE)
}
tau.L <- tau.hat - z * sqrt(sigma.hat.2)
tau.U <- tau.hat + z * sqrt(sigma.hat.2)
} else {
# append するのではなく前もって必要メモリ確保
# こうするだけで,実行時間が 1/5 になる!
tau <- numeric(B)
for (b in 1:B) {
# sample() の第1引数は 1:n ではなく n とする
b.sample <- sample(n, n, replace = TRUE)
# cor.test ではなく cor.fk を使う
#options(warn = -1)
#tau.sample <- cor.test(x[b.sample], y[b.sample],
# method = "k")
#options(warn = 0)
#tau.sample <- tau.sample$estimate
tau[b] <- cor.fk(x[b.sample], y[b.sample])
}
tau.hat <- sort(tau)
# hist(tau.hat)
if (type == "t") {
k <- floor((B + 1) * alpha/2)
} else { #if (type != "t")
k <- floor((B + 1) * alpha)
}
tau.L <- tau.hat[k]
tau.U <- tau.hat[(B + 1 - k)]
}
# tau.L <- round(tau.L, 3)
# tau.U <- round(tau.U, 3)
cat("\nn =", n, ", kendall tau =", kendall.tau,"\n")
if (type == "t") {
print.type <- " two-sided CI for tau:"
} else if (type == "l") {
tau.U <- 1
print.type <- " lower bound for tau:"
} else { # (type == "u")
tau.L <- -1
print.type <- " upper bound for tau:"
}
cat("\n")
cat("1 - alpha = ", 1 - alpha, print.type)
cat("\n")
cat(tau.L, ", ", tau.U, "\n")
cat("\n")
}
kendall.ci2(example=TRUE)
# 1 - alpha = 0.95 two-sided CI for tau:
# -0.05255393, 0.9414428
#VVVVVVVVVVVVVVVVVVVVVVVVVVVVVVVVVVVV
# n = 9 , kendall tau = 0.4444444
#
# 1 - alpha = 0.95 two-sided CI for tau:
# -0.05255393 , 0.9414428
system.time(kendall.ci2(bootstrap=TRUE, B= 60000, example=TRUE))
# 1 - alpha = 0.95 two-sided CI for tau:
# -0.125, 0.93103448275862
#
# user system elapsed
# 30.948 1.308 32.220
#VVVVVVVVVVVVVVVVVVVVVVVVVVVVVVVVVVVV
# n = 9 , kendall tau = 0.4444444
#
# 1 - alpha = 0.95 two-sided CI for tau:
# -0.125 , 0.9310345
#
# user system elapsed
# 0.865 0.007 0.872
#
# 35倍速になった!!
Julia プログラム
using Statistics, StatsBase, Distributions, Plots
function kendall_ci(x, y; alpha = 0.05, type = :both, bootstrap = false,
B = 1000)
n = length(x)
length(x) <= 1 && error("\nSample size n must be at least two!\n")
length(y) != n && error("\nSamples must be of the same length!\n")
isnothing(indexin([type], [:both, :left, :right])[1]) &&
error("\nArgument \"type\" must be one of \":both\" (symmetric), ",
"\":left\" (lower) or \":right\" (upper)!")
function Q(xi, yi, xk, yk)
ij = (yk - yi) * (xk - xi)
ij > 0 && return 1
ij < 0 && return -1
0
end
function C_i(x, y, i)
C = 0
for k in 1:length(x)
k != i && (C += Q(x[i], y[i], x[k], y[k]))
end
C
end
if !bootstrap
c_i = Int[]
for i in 1:n
append!(c_i, C_i(x, y, i))
end
tau_hat = corkendall(x, y)
isnan(tau_hat) && error("corkendall returned 'NaN'")
sigma_hat_2 = 2 * (n - 2) * var(c_i)/n/(n - 1)
sigma_hat_2 += 1 - (tau_hat)^2
sigma_hat_2 *= 2/n/(n - 1)
z = quantile(Normal(), alpha/(type == :both ? 2 : 1))
tau_L, tau_U = tau_hat .+ [1, -1] * z * sqrt(sigma_hat_2)
else
tau = Float64[]
for b in 1:B
b_sample = rand(1:n, n)
tau_sample = corkendall(x[b_sample], y[b_sample])
isnan(tau_sample) || append!(tau, tau_sample)
end
tau_hat = sort(tau)
B = length(tau_hat)
histogram(tau_hat)
k = floor(Int, (B + 1) * alpha/(type==:both ? 2 : 1))
tau_L = tau_hat[k]
tau_U = tau_hat[(B + 1 - k)]
end
if type == :both
print_type = "two-sided CI"
elseif type == :left
print_type = "lower bound"
tau_U = 1
else
print_type = "upper bound"
tau_L = -1
end
println("1 - alpha = $(1 - alpha) $print_type for tau:\n")
println("$tau_L, $tau_U")
end
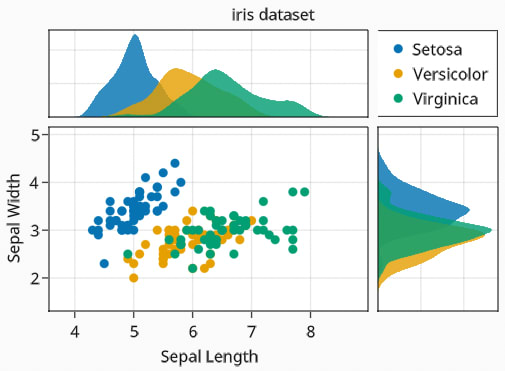
Julia では,グラフ作成のためのパッケージが色々あるので,少しずつつまみ食いしている。
GRMalie(Makie) を試してみたが,その中では以下のものが目に止まった。
iris データを使って書いてみた。ただし,Makie では,grid を消すことができないそうだ。grid も含めて tick などもまとめて消すことはできるようだが,それでは副作用が大きすぎる。
また,標榜しているほどきれいでもない。
なので,今後も使う予定はない。

using GLMakie
using FileIO
using ColorTypes
using RDatasets
noto_sans = assetpath("fonts", "NotoSans-Regular.ttf")
noto_sans_bold = assetpath("fonts", "NotoSans-Bold.ttf")
f = Figure(backgroundcolor = RGB(0.98, 0.98, 0.98),
resolution = (1000, 700), font = noto_sans)
ga = f[1, 1] = GridLayout()
gb = f[2, 1] = GridLayout()
gcd = f[1:2, 2] = GridLayout()
gc = gcd[1, 1] = GridLayout()
gd = gcd[2, 1] = GridLayout()
axtop = Axis(ga[1, 1])
axmain = Axis(ga[2, 1], xlabel = "Sepal Length", ylabel = "Sepal Width")
axright = Axis(ga[2, 2])
linkyaxes!(axmain, axright)
linkxaxes!(axmain, axtop)
iris = dataset("datasets", "iris")
labels = ["Setosa", "Versicolor", "Virginica"]
data = Array{Float64, 3}(undef, 50, 2, 3);
data[:, :, 1] = Matrix(iris[1:50, 1:2]);
data[:, :, 2] = Matrix(iris[51:100, 1:2]);
data[:, :, 3] = Matrix(iris[101:150, 1:2]);
for (label, col) in zip(labels, eachslice(data, dims = 3))
scatter!(axmain, col, label = label)
density!(axtop, col[:, 1])
density!(axright, col[:, 2], direction = :y)
end
ylims!(axtop, low = 0)
xlims!(axright, low = 0)
leg = Legend(ga[1, 2], axmain)
hidedecorations!(axtop, grid = false)
hidedecorations!(axright, grid = false)
leg.tellheight = true
colgap!(ga, 10)
rowgap!(ga, 10)
Label(ga[1, 1:2, Top()], "iris dataset", valign = :bottom,
padding = (0, 0, 5, 0))
f