算額(その234)
中村信弥「改訂増補 長野県の算額」
http://www.wasan.jp/zoho/zoho.html
県内の算額3(223)
長野県東筑摩郡筑北村青柳 碩水寺豊川稲荷社 慶応4年(1868)
算額(その4)を一段階複雑にしたものである。https://blog.goo.ne.jp/r-de-r/e/faa0efc125cc1b246538a9965949f782
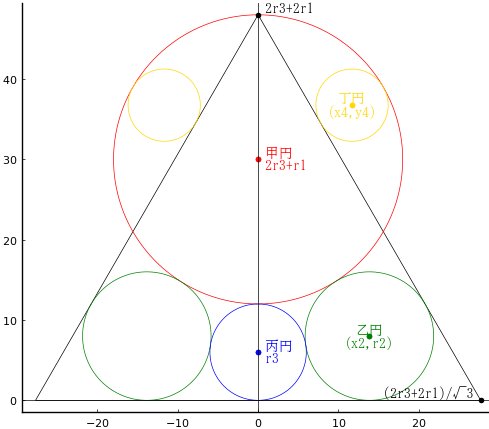
正三角形と甲円,乙円,丙円,丁円がある。乙円,丁円の径がそれぞれ 16寸,9寸のとき,丙円の径を求めよ。

甲円の半径 r1, (0, 2r3 + r1),
乙円の半径 r2, (x2, r2),
丙円の半径 r3, (r3, r3),
丁円の半径 r4, (x4, y4),
だたし,r2 = 16/2, r4 = 9/2
また,x4, y4 は r1, r3 から求めることができる
以下の方程式を解き,r1, r3, x2 を求める。
include("julia-source.txt")
using SymPy
@syms r1::positive, r2::positive, r3::positive, r4::positive,
x2::positive;
(r2, r4) = (16//2, 9//2)
eq1 = x2^2 + (r2 - r3)^2 - (r2 + r3)^2
eq2 = x2^2 + (2r3 + r1 - r2)^2 - (r1 + r2)^2
eq3 = r1 / 2 - 2r4;
solve([eq1, eq2, eq3], (r1, r3, x2))[1]
(18, 6, 8*sqrt(3))
(r1, r3, x2) = (18, 6, 8*sqrt(3))
(18, 6, 13.856406460551018)
ついで,x4, y4 を求める。
x4 = (r1*(3/4))*sqrt(3)/2
y4 = 2r3 + r1 + (r1*(3/4))/2
(x4, y4)
(11.69134295108992, 36.75)
r1 = 18, r3 = 6, x2 = 13.8564065; x4 = 11.6913430; y4 = 36.75
丙円の半径 r3 = 6 なので,元の単位での直径は 12 寸である。
function draw(more)
pyplot(size=(500, 500), grid=false, aspectratio=1, label="", fontfamily="IPAMincho")
(r1, r3, x2) = (18, 6, 8*sqrt(3))
x4 = (r1*(3/4))*sqrt(3)/2
y4 = 2r3 + r1 + (r1*(3/4))/2
@printf("r1 = %.7f; r3 = %.7f; x2 = %.7f\n", r1, r3, x2)
@printf("x4 = %.7f; y4 = %.7f\n", x4, y4)
y = 2r3 + 2r1
x = y/sqrt(3)
plot([x, 0, -x, x], [0, y, 0, 0], color=:black, lw=0.5)
circle(0, 2r3 + r1, r1, :red)
circle(x2, r2, r2, :green)
circle(-x2, r2, r2, :green)
circle(0, r3, r3, :blue)
circle(x4, y4, r4, :gold)
circle(-x4, y4, r4, :gold)
if more == true
point(0, 2r3 + r1, " 2r3+r1", :red)
point(0, 2r3 + r1, " 甲円", :red, :left, :bottom)
point(0, 2r3 + 2r1, " 2r3+2r1", :black, :left, :bottom)
point((2r3 + 2r1)/√3, 0, "(2r3+2r1)/√3 ", :black, :right, :bottom)
point(x4, y4, "(x4,y4)", :gold, :center)
point(x4, y4, "丁円", :gold, :center, :bottom)
point(0, r3, " r3", :blue)
point(0, r3, " 丙円", :blue, :left, :bottom)
point(x2, r2, "(x2,r2)", :green, :center)
point(x2, r2, "乙円", :green, :center, :bottom)
hline!([0], color=:black, lw=0.5)
vline!([0], color=:black, lw=0.5)
else
plot!(showaxis=false)
end
end;


