


算額(その647)
長野県長和町 駒形神社 明治8年(1875)
中村信弥「改訂増補 長野県の算額」
http://www.wasan.jp/zoho/zoho.html
5 個の等円が隣の等円と外接し円弧に外接している。両端の等円は弦の延長線に接している。
矢が 8 寸,弦が 24 寸のとき,等円の直径を求めよ。
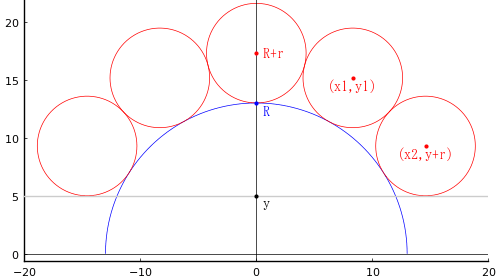
円弧が一部である円の半径と中心座標を R, (0, 0)
等円の半径と中心座標を r, (0, R + r), (x1, y1), (x2, y + r)
弦と y 軸の交点座標を (0, y)
とおき,以下の連立方程式を解く。
include("julia-source.txt");
# julia-source.txt ソース https://blog.goo.ne.jp/r-de-r/e/ad3a427b84bb416c4f5b73089ae813cf
using SymPy
@syms R::positive, r::positive, y::positive,
x1::positive, y1::positive, x2::positive, y2::positive
eq1 = x1^2 + y1^2 - (R + r)^2
eq2 = x2^2 + (y + r)^2 - (R + r)^2
eq3 = x1^2 + (R + r - y1)^2 - 4r^2
eq4 = (x2 - x1)^2 + (y1 - y - r)^2 - 4r^2
eq5 = y - sqrt(R^2 - 12^2)
eq6 = y - (R - 8)
using NLsolve
function nls(func, params...; ini = [0.0])
if typeof(ini) <: Number
r = nlsolve((vout, vin) -> vout[1] = func(vin[1], params..., [ini]), ftol=big"1e-40")
v = r.zero[1]
else
r = nlsolve((vout, vin)->vout .= func(vin, params...), ini, ftol=big"1e-40")
v = r.zero
end
return v, r.f_converged
end;
function H(u)
(R, r, y, x1, y1, x2) = u
return [
x1^2 + y1^2 - (R + r)^2, # eq1
x2^2 - (R + r)^2 + (r + y)^2, # eq2
-4*r^2 + x1^2 + (R + r - y1)^2, # eq3
-4*r^2 + (-x1 + x2)^2 + (-r - y + y1)^2, # eq4
y - sqrt(R^2 - 144), # eq5
-R + y + 8, # eq6
]
end;
g = 12
iniv = BigFloat[13, 4.3, 5, 8.3, 15, 14.6]
res = nls(H, ini=iniv)
(BigFloat[13.0, 4.292842863236655796258424878247800048144346796834551378448796255304952228172366, 5.0, 8.316932815223808406463820238890995876085407092697237813856266028198192952429316, 15.16149870031483123032399683773288234968648696208586379659490076589161640834934, 14.58374046024498108560260206110599459102827635604655955326101083845210751031903], true)
等円の直径は約 8.58569 となるが,中村も指摘しているように,題意が不明瞭であることと,原問題の条件と答えに合う図にならない。
その他のパラメータは以下の通り。
R = 13; r = 4.29284; y = 5; x1 = 8.31693; y1 = 15.1615; x2 = 14.5837
function draw(more=false)
pyplot(size=(500, 500), grid=false, aspectratio=1, label="", fontfamily="IPAMincho")
(R, r, y, x1, y1, x2) = res[1]
@printf("等円の直径 = %g; R = %g; r = %g; y = %g; x1 = %g; y1 = %g; x2 = %g\n",
2r, R, r, y, x1, y1, x2)
plot()
circle(0, 0, R, :blue, beginangle=0, endangle=180)
circle(0, R + r, r, :red)
circle(x1, y1, r, :red)
circle(-x1, y1, r, :red)
circle(x2, y + r, r, :red)
circle(-x2, y + r, r, :red)
hline!([y], color=:gray80)
if more
delta = (fontheight = (ylims()[2]- ylims()[1]) / 500 * 10 * 2) /3 # size[2] * fontsize * 2
vline!([0], color=:black, lw=0.5)
hline!([0], color=:black, lw=0.5)
point(0, y, " y", :black, :left, delta=-delta/2)
point(0, R, " R", :blue, :left, delta=-delta/2)
point(0, R + r, " R+r", :red, :left, :vcenter)
point(x1, y1, "(x1,y1)", :red, :center, delta=-delta/2)
point(x2, y + r, "(x2,y+r)", :red, :center, delta=-delta/2)
end
end;


