算額(その118)
一関市博物館 > 和算に挑戦 > 平成18年度出題問題(3) [上級問題]&解答例
文政13年(1830)刊『算法新書』より
https://www.city.ichinoseki.iwate.jp/museum/wasan/h18/hard.html
岩手県奥州市 玉崎神社 弘化5年(1848)
https://w.atwiki.jp/sangaku/pages/191.html
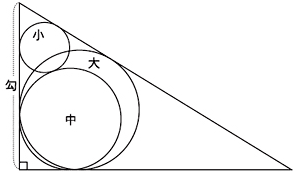
直角三角形の中に大中小の3つの円がある。大円,中円,小円の径をそれぞれ 18cm,16cm,9cm としたとき,勾(鉤)の長さを求めよ。
出題では円の直径であるが,小数点がつかないように2倍して半径を用いる。
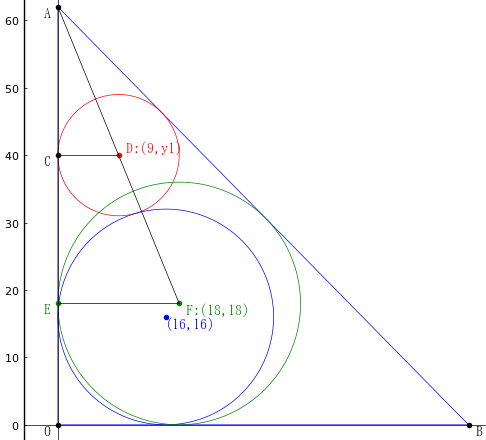
図のように記号を定め,方程式を解く。
eq1 だけで y1=40 がわかるので,⊿ACD, ⊿AEF が相似(相似比 1:2)なので,答え 40+22=62 はすぐに導ける(一応 eq2 がそれに対応している)。もとの単位では 31cm である。eq2, eq3 は図を描くためにつけたし。

using SymPy
@syms x, y, y1::positive
eq1 = (9 - 16)^2 + (y1 - 16)^2 - (9 + 16)^2
eq2 = 18(y - y1) - 9(y - 18)
eq3 = x*y - 18(x + y + sqrt(x^2 + y^2))
res = solve([eq1, eq2, eq3], (x, y, y1))
1-element Vector{Tuple{Sym, Sym, Sym}}:
(792/13, 62, 40)
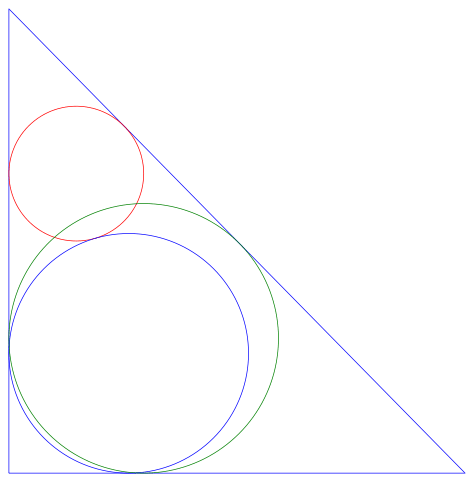
y = 62,もとの単位では 31cm。
using Plots
function circle(ox, oy, r, color=:red; beginangle=0, endangle=360)
θ = beginangle:0.1:endangle
x = r.*cosd.(θ)
y = r.*sind.(θ)
plot!(ox .+ x, oy .+ y, color=color, linewidth=0.5)
end;
function point(x, y, string="", color=:green, position=:left, vertical=:top; mark=true)
mark && scatter!([x], [y], color=color, markerstrokewidth=0)
annotate!(x, y, text(string, 10, position, color, vertical))
end;
function segment(x1, y1, x2, y2, color=:black; linestyle=:solid, linewidth=0.5)
plot!([x1, x2], [y1, y2], color=color, linestyle=linestyle, linewidth=linewidth)
end;
function draw(more)
pyplot(size=(500, 500), grid=false, aspectratio=1, label="", fontfamily="IPAMincho")
(x, y, y1) = res[1]
plot([0, x, 0, 0], [0, 0, y, 0], color=:blue, lw=0.5)
circle(9, y1, 9)
circle(16, 16, 16, :blue)
circle(18, 18, 18, :green)
if more == true
point(9, y1, " D:(9,y1)", :red, :left, :bottom)
point(16, 16, "(16,16)", :blue)
point(0, 18, "E ", :green, :right)
point(18, 18, " F:(18,18)", :green)
point(0, 0, "O ", :black, :right)
point(0, y, "A ", :black, :right)
point(0, y1, "C ", :black, :right)
point(x, 0, " B", :black)
#segment(0, y, x, 0)
segment(0, y, 18, 18)
segment(0, 18, 18, 18)
segment(0, 40, 9, 40)
hline!([0], color=:black, lw=0.5, ylims=(-5, 65))
vline!([0], color=:black, lw=0.5, xlims=(-5, 65))
else
plot!(showaxis=false)
end
end;


