算額(その507)
長岡高専和算倶楽部オリジナル算額
山田 章,谷口 悠,加藤 祐樹,長谷川 柊太,平田 大成,中山 雅友美,冨樫 瑠美,涌田 和芳: 長岡高専和算倶楽部オリジナル算額について,長岡工業高等専門学校研究紀要,57 巻,p. 41-45,2021.
https://kinpoku.nagaoka-ct.ac.jp/lib/kiyo/vol_57/57_41yamada.pdf
正三角形に内接する正方形(正方形の3つの頂点が正三角形の 3 つの辺上にある)の一辺の長さが最小になるのはどのようなときか。

正三角形の一辺の長さを a,正方形の一辺の長さを b とする。
正方形の 4 つの頂点座標を (x1, 0 ), (x2, y2), (x3, y3), (x4, y4) とする。
(x1, 0), (x2, y2) を結ぶ線分が正三角形の底辺となす角を θ° として,
以下の連立方程式を解く。

include("julia-source.txt");
using SymPy
@syms a, b, θ, x1, x2, y2, x3, y3, x4, y4
x2 = x1 + b*cosd(θ)
y2 = b*sind(θ)
x3 = x2 - b*sind(θ)
y3 = y2 + b*cosd(θ)
x4 = x1 - b*sind(θ)
y4 = b*cosd(θ)
eq1 = y4/x4 - sqrt(Sym(3))
eq2 = y3/(a - x3) - sqrt(Sym(3))
res = solve([eq1, eq2], (x1, b))
Dict{Any, Any} with 2 entries:
b => sqrt(3)*a/(2*(sin(pi*(θ/180 + 1/3)) + cos(pi*θ/180)))
x1 => a*sin(pi*(θ/180 + 1/6))/(sin(pi*(θ/180 + 1/3)) + cos(pi*θ/180))
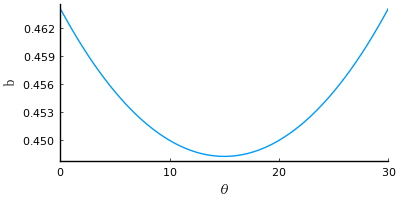
正方形の一辺の長さは sqrt(3)/(2*(sin(pi*(θ/180 + 1/3)) + cos(pi*θ/180))) である。
0 ≦ θ ≦ 30 で図を描くと以下のようになる。
using Plots
pyplot(size=(400, 200), grid=false, aspectratio=:none, label="", fontfamily="IPAMincho")
plot(res[b]/a, xlims=(0, 30), xlabel="θ", ylabel="b")

b の式の導関数を求め,導関数 = 0 となる θ を求め,そのときの b の値を求める。
正三角形の一辺の長さを a とすれば,θ が 15° のとき,正方形の一辺の長さは最小値 (3√2 - √6)a/4 = 0.448287736084027a になる。
solve(diff(res[b]/a))[1] |> println
15
eq = (res[b])(θ => 15) |> simplify
eq |> println
eq(θ => 15).evalf() |> println
-sqrt(6)*a/4 + 3*sqrt(2)*a/4
0.448287736084027*a
a = 1; θ = 15; x1 = 0.366025; b = 0.448288
using Plots
function draw(more=false)
pyplot(size=(500, 500), grid=false, aspectratio=1, label="", fontfamily="IPAMincho")
a = 1
θ = 15
b = sqrt(3)*a/(2*(sin(pi*(θ/180 + 1/3)) + cos(pi*θ/180)))
x1 = a*sin(pi*(θ/180 + 1/6))/(sin(pi*(θ/180 + 1/3)) + cos(pi*θ/180))
@printf("a = %g; θ = %g; x1 = %g; b = %g\n", a, θ, x1, b)
plot([0, a, a/2, 0], [0, 0, √3*a/2, 0], color=:black, lw=0.5)
x2 = x1 + b*cosd(θ)
y2 = b*sind(θ)
x3 = x2 - b*sind(θ)
y3 = y2 + b*cosd(θ)
x4 = x1 - b*sind(θ)
y4 = b*cosd(θ)
plot!([x1, x2, x3, x4, x1], [0, y2, y3, y4, 0], color=:blue, lw=0.5)
if more
delta = (fontheight = (ylims()[2]- ylims()[1]) / 500 * 10 * 2) /3 # size[2] * fontsize * 2
hline!([0], color=:black, lw=0.5)
vline!([0], color=:black, lw=0.5)
point(x1, 0, "(x1,0) ", :blue, :right, :bottom, delta=delta/2)
point(x2, y2, "(x2,y2)", :blue, :left, delta=-delta/2)
point(x3, y3, " (x3,y3)", :blue, :left, :vcenter)
point(x4, y4, " (x4,y4)", :blue, :left, delta=-delta/2)
point(a/2, √3a/2, " (a/2, √3a/2)", :black, :left, :vcenter)
point(a, 0, "a", :black, :left, :bottom, delta=delta/2)
else
plot!(showaxis=false)
end
end;


※コメント投稿者のブログIDはブログ作成者のみに通知されます