2019/12/10 にもナイチンゲールの鶏頭図について書いたが,それは R であった。
そのときには,HistData パッケージの Nightingale は知らなかった。
中澤先生が example(Nightingale) で描けると言及していたので,やってみた。
melt がないとか,reshape がないとか,ggplot2 がないとかうるさかった割に,ちょっと残念な出来栄えだった。
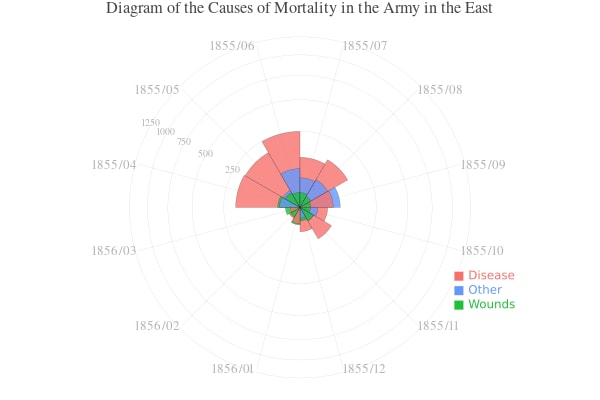
ので,Julia で描いたみた。ggplot の呪いがないので,スッキリ書けたと思う。プログラムは下の方に。
2 枚の図は描画範囲を一致させている。ちょっと,色がどぎつい。

using RDatasets, DataFrames
Nightingale = dataset("HistData", "Nightingale");
using Colors, Plots, Dates
function spidernet(df, begin_)
θ = range(0, 360, length=1200)
for deg in 250:250:1250
r = sqrt(deg)
plot!(r * cosd.(θ), r * sind.(θ), color=:gray70)
annotate!(r * cosd(150), r * sind(150),
text(string(deg), 6, :gray70, "times"))
end
for i in 1:12
pos = sqrt(1200)
x = pos*cosd(begin_[i] - 15)
y = pos*sind(begin_[i] -15)
plot!([0, x], [0, y], color=:gray70)
annotate!(x, y,
text(Dates.format.(df[i, 1], "yyyy/mm"), 8,
:gray70, "times", 4<=i<=9 ? :left : :right))
end
end
function legend_(df, color)
for (y, col, leg) in zip(-14:-3:-20, color,
["■ Disease", "■ Other", "■ Wounds"])
annotate!(32, y, text(leg, 8, :left, col, "times"))
end
end
function nightingale(df)
begin_ = 180:-30:-210
# color = [colorant"#b1bbc1", colorant"#e6b4b7", colorant"#6f625e"];
color = [colorant"#f6716d", colorant"#6298ff", colorant"#1fbf38", ];
gr(grid=false, showaxis=false, ticks=false, aspect_ratio=1, lw=0.2,
titlefont = (10, "times"), label="")
p = plot(title="Diagram of the Causes of Mortality in the Army in the East")
spidernet(df, begin_)
legend_(df, color)
for i in 1:12
deg = range(begin_[i], begin_[i+1], length = 100)
for j in sortperm(Vector(df[i, 8:10]), rev = true)
r = sqrt(df[i, j+7])
x = vcat(0, r * cosd.(deg))
y = vcat(0, r * sind.(deg))
plot!(x, y, seriestype=:shape, fillcolor = color[j], label="")
end
end
p
end
nightingale(Nightingale[1:12, :])
nightingale(Nightingale[13:24, :])








https://blog.goo.ne.jp/r-de-r/e/0c16be5592393687449b03d4561b9af7
ですね。
plotrixパッケージのradial.pie()で簡単に描けるかと思ったのですが、値が面積ではなく半径として使われてしまうので、少し工夫が必要ですね