このブログは「すぐに役立つ統計のコツ」(オーム社)に紹介されている内容をもとに書いています。

前回に引き続き「第2章 分析の準備」(6ページ)の内容に関連して beeswarm(蜂群図:蜂の群れ)をご紹介しましょう。
それでは、
データ解析環境「R」で beeswarm を作図してみましょう。
それでは、
データ解析環境「R」で beeswarm を作図してみましょう。
「R」での方法
まず、
はじめにプログラム・パッケージ「beeswarm」をインストールしておきましょう。
はじめにプログラム・パッケージ「beeswarm」をインストールしておきましょう。
そして、
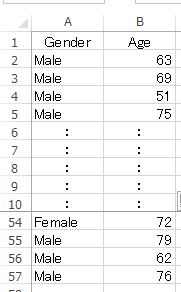
前回(図1:年齢と性別)のデータを使ってやってみましょう。
***
library(beeswarm)
boxplot(Age~ Gender, ylim = c(30, 90), main = "swarm")
beeswarm(Age~ Gender, pch = 16, method = "swarm", add = TRUE)
***
library(beeswarm)
boxplot(Age~ Gender, ylim = c(30, 90), main = "swarm")
beeswarm(Age~ Gender, pch = 16, method = "swarm", add = TRUE)
***
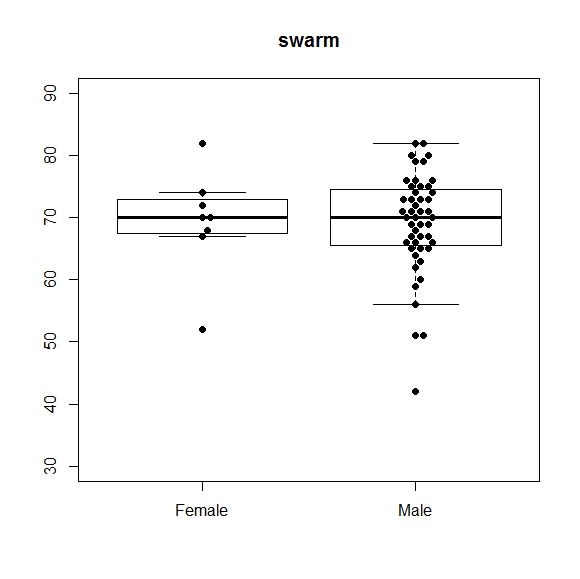
出力結果は図1の様になります。
図1"箱ひげ図" と"bee swarm"

プロット(点)の配置方法は、
method = "center" , "hex" , "square" で変えることが出来ます。
次の様な乱数を発生させて試してみて下さい。
***
x <- rnorm(100, 25, 10) # 50個の乱数(平均値 25、標準偏差 10)
y <- rnorm(100, 30, 15) # 50個の乱数(平均値 30、標準偏差 15)
x <- rnorm(100, 25, 10) # 50個の乱数(平均値 25、標準偏差 10)
y <- rnorm(100, 30, 15) # 50個の乱数(平均値 30、標準偏差 15)
# 色々な beeswarm を描いてみましょう。
beeswarm(list(x, y), pch = 16, method = "swarm", main = "swarm")
beeswarm(list(x, y), pch = 16, method = "center", main = "center")
beeswarm(list(x, y), pch = 16, method = "hex", main = "hex")
beeswarm(list(x, y), pch = 16, method = "square", main = "square")
beeswarm(list(x, y), pch = 16, method = "center", main = "center")
beeswarm(list(x, y), pch = 16, method = "hex", main = "hex")
beeswarm(list(x, y), pch = 16, method = "square", main = "square")
***
それでは、
次回は「中央値の95%信頼区間」を表す "Notch Box Plot" をご紹介します。
「すぐに役立つ統計のコツ」(第2章:9ページ)をご参照下さい。
次回は「中央値の95%信頼区間」を表す "Notch Box Plot" をご紹介します。
「すぐに役立つ統計のコツ」(第2章:9ページ)をご参照下さい。
情報統計研究所はここから!


