「第4章 データの分布を見る技術(1)」:(http://toukei.sblo.jp/)では、
Excel でのヒストグラム作成の技術を紹介したが、結構めんどうだ.
何故なら、
ヒストグラムの階級数(Bins)を自ら設定する必要があるからだ.
Bin はどの様に決めれば良いのだろうか.
単純には、
級間(hi) = MIN(X)+( MAX(X)-Min(X) ) * i / k
i=階級の番号 級数(k)=SQRT(n) :n=データの個数
・・とするなど、あるいは、
「スタージェスの方法」、「・フリードマン-ディアコニスの方法」、「スコットの方法」などあるが、
「R」では、これらの方法を任意に設定出来る.
要するに、ヒストグラムはデータの分布を適切に表しているかどうかである.
「R」の環境がなければ、
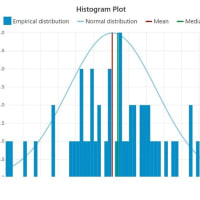
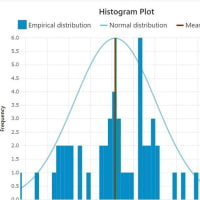
統計技術的には、無料の「Histogram Online Calculator」(下記URL)を上手に利用される事をお勧めしたい.
https://www.answerminer.com/calculators/histogram

紹介記事(抜粋)
***
What is histogram ?
Histograms are the most useful tool to say something about a bunch of numeric values.
Compared to other summarizing methods, histograms have the richest descriptive power while being the fastest way to interpret data – the human brain prefers visual perception.
However, if you are not careful, viewers will not be able to understand your histogram, or you may fail to get the most out of it.
It is especially important to specify the optimal bin size.
You can set the bin size under the visualization.
Which is the ideal bin size ?
It depends on your data. First time when you copy your data, our smart algorithm calculates the ideal bin size, but you can change it if you want.
***


統計技術へのアクセスはここから!
http://toukei.sblo.jp/


