


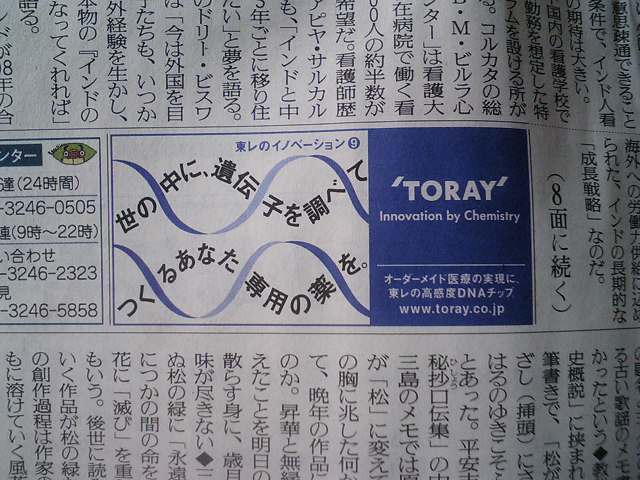
写真は、先日(11/28)の読売新聞朝刊に載っていた広告です。
「世の中に、遺伝子を調べてつくるあなた専用の薬を。
オーダーメイド医療の実現に、東レの高感度DNAチップ」
文中の『DNAチップ』は、当ブログの【論文記録】でよく出てくる『マイクロアレイ』と同等品です。過去にもマイクロアレイ関連の広告が載っていたかもしれませんが、今回それに初めて気がつき、「マイクロアレイもここまで来たか」と、小さな広告ながら軽い驚きを覚えました。
ブログ読者の方々からは、【論文記録】については「さっぱりワケわからん」、「無条件に読み飛ばす」、「何語??」等々、自分とは全く関わりない世界の話であるように感じている方が多いようですが、実は皆様の日常に徐々に近づきつつある技術だったりします。
現在、手間と費用がかかるガンをはじめとする様々な疾病の診断が、マイクロアレイひとつで簡単に診断できてしまったり、さらに技術が進み、産まれた赤ちゃんの遺伝子を検査することで、その将来が予測できたり、なんてことになるとその需要は計り知れません。もし、それに関する特許なんて取ろうものなら……いったい焼肉がどれだけ食えることか……(←そこか)
論文を読んでいると、そこで使われているデータはほとんどアメリカのAffymetrix社製のGeneChipの独壇場です。それに追随すべく日本の企業もがんばっているのですね。
私の研究テーマはマイクロアレイそのものを創るわけではなく、その道具を使って得られる(数値)データをどう処理して病気診断等に役立てるか、というところを問題にしています。
難しい話はともかく、この記事で【論文記録】のこともちょっとは「ワケわかって」もらえたらと思います。
《関連サイト》
東レ 映像・広告ライブラリー
http://www.toray.co.jp/visual/adv_007.html
東レ 研究・技術開発 トピックス~DNAチップ
http://www.toray.co.jp/technology/topics/top_004.html


